ENEnglish
 LTLietuviškai
 DEDeutsch
 FRFrançais
 RUРусский
 ESEspañol
 PLPolski
 ITItaliano
 UKУкраїнська
 CSČeština
 PTPortuguês
 JA日本語
JA日本語 LVLatviešu valoda
 ETEesti
 HUMagyar
 IDBahasa Indonesia
 TRTürkçe
 HIहिन्दी
 ELΕλληνικά
 ARالعربية
 THไทย
THไทย VITiếng Việt
 RORomână
 MSBahasa Melayu
 BNবাংলা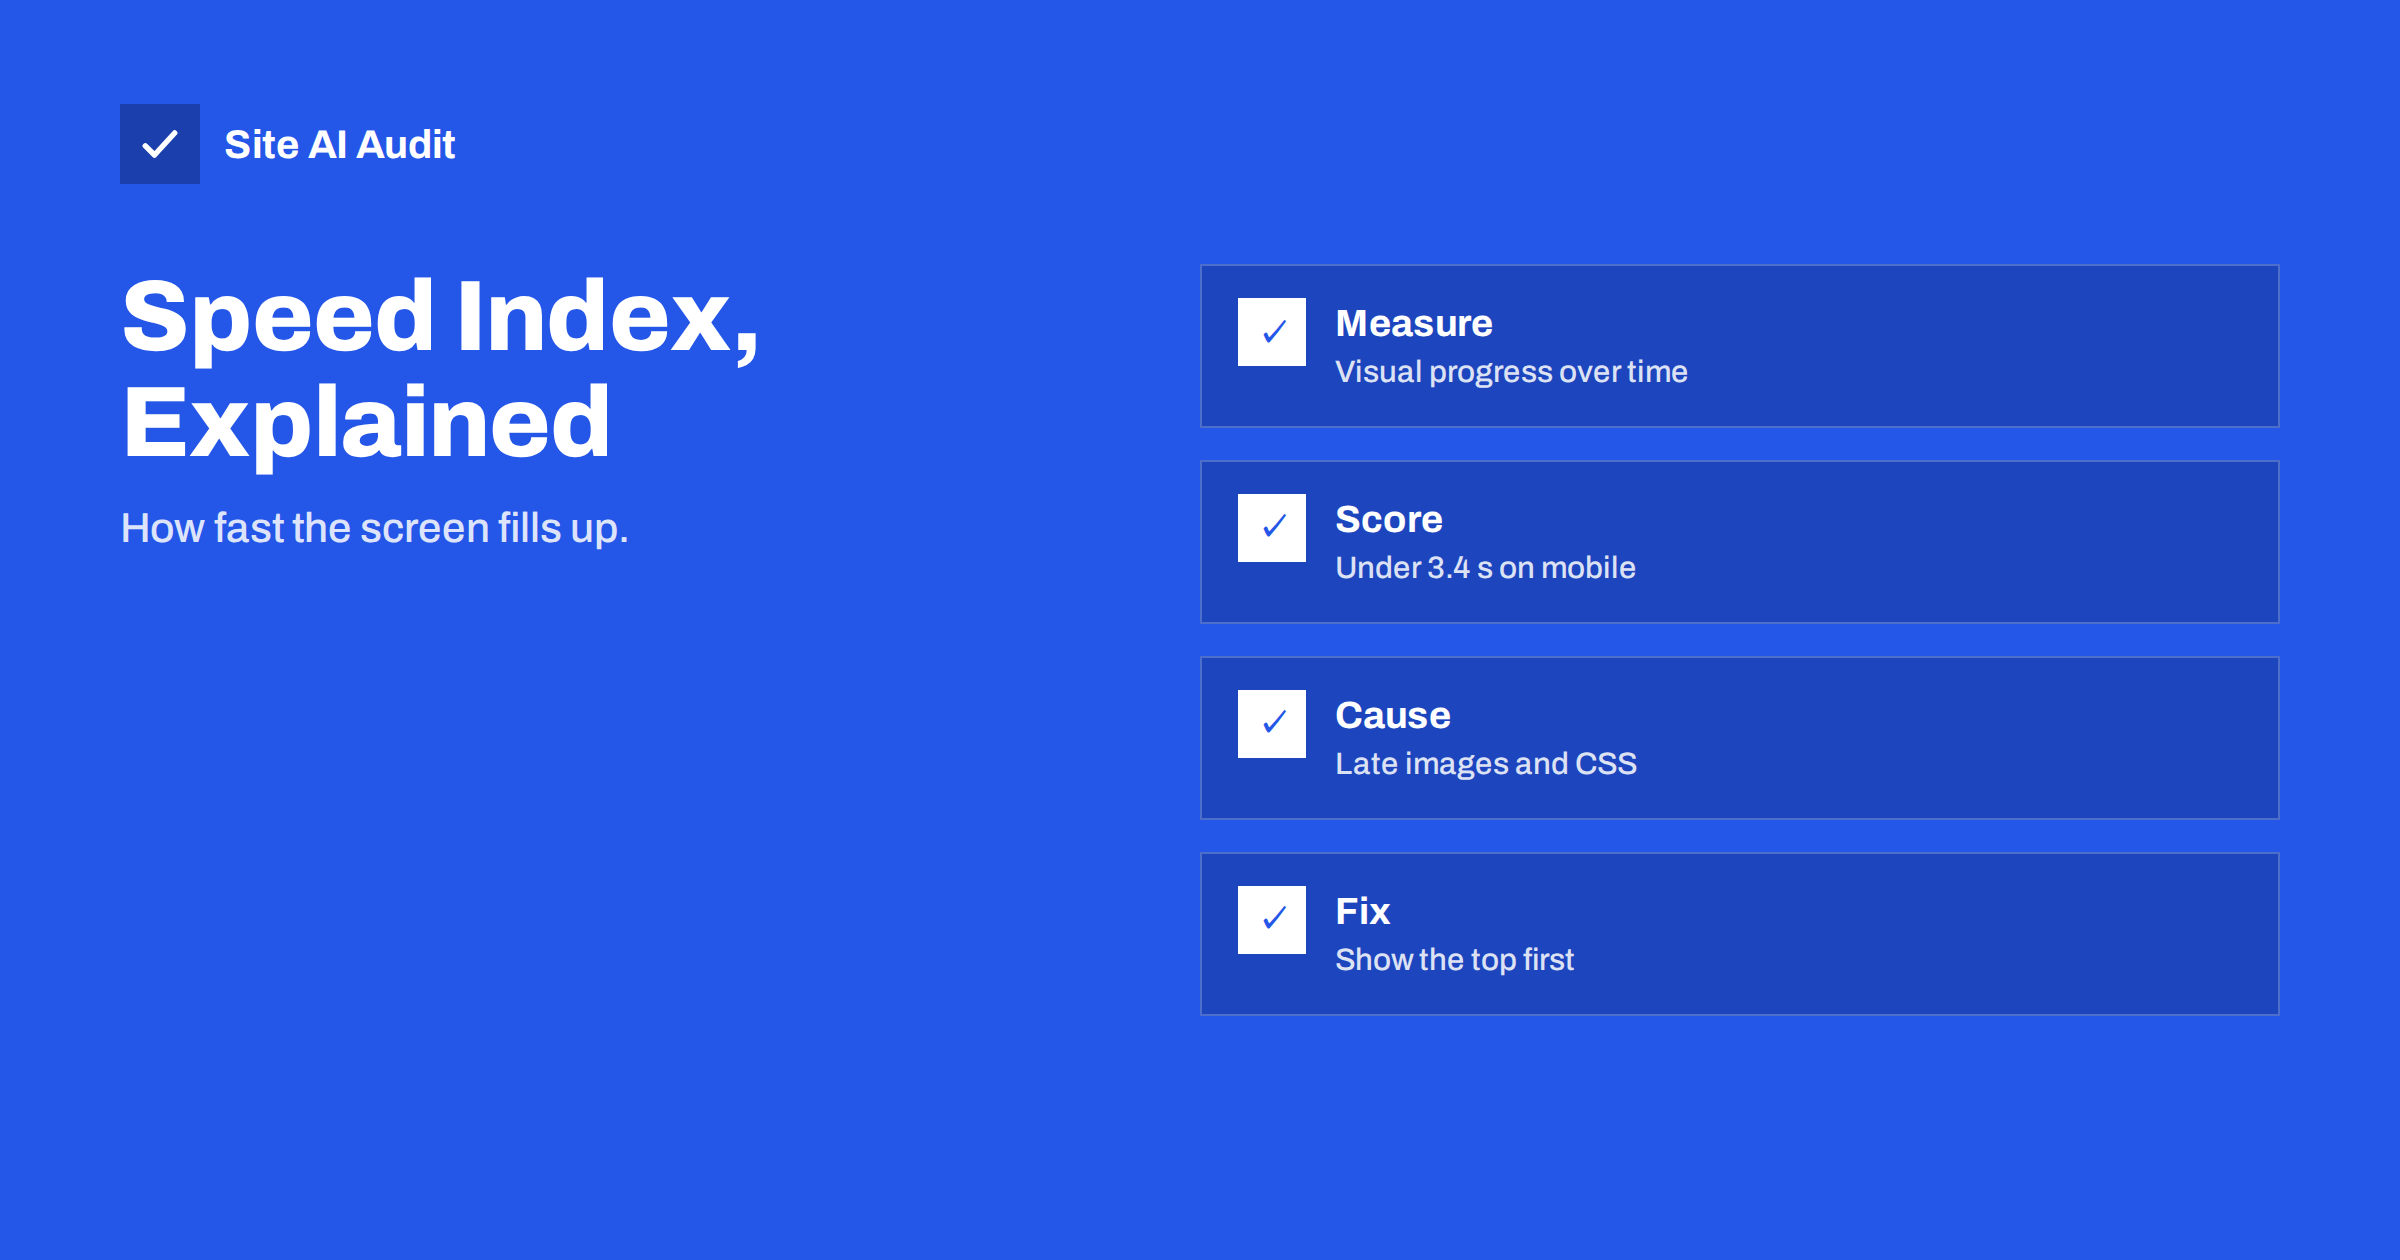
Short answer: Speed Index is a Lighthouse metric that measures how quickly the visible part of a page fills with content while it loads. Lighthouse records a video of the load and scores how early the screen looks finished; a lower number is better. On mobile in Lighthouse, a Speed Index under about 3.4 seconds is rated good. You improve it by showing the top of the page sooner: faster server responses, less render-blocking code, smaller above-the-fold images and early loading of the main content.
What Speed Index measures
Most speed metrics capture a single moment, such as the first paint or the time when the largest element is shown. Speed Index looks at the whole journey. It asks how much of the visible area was complete at each point in time, and combines that into one number in seconds.
Two pages can both finish loading in four seconds, yet feel very different. The first shows nothing for three seconds and then everything appears at once. The second shows the layout, text and main image within one second and finishes the rest in the background. The second page has the lower Speed Index, and visitors would call it faster. That makes Speed Index a good measure of perceived loading speed.
How Lighthouse calculates it
Lighthouse loads your page in a controlled browser and records screenshots of the viewport as the page loads. It compares each frame with the final state and works out the share of the page that looks finished at that time, from 0 to 100 percent. The Speed Index is the area above that visual progress curve, in other words the average time it takes for content to appear.
Some important consequences follow:
- It only considers what is visible on screen, so content far below the fold does not count.
- It is a lab metric. It is not part of the Core Web Vitals, and field data from real visitors does not include it.
- It depends on the device and network that the test simulates. Mobile tests use a slower processor and connection than desktop tests, so scores differ widely between the two.
- Animations and rotating banners affect the result, because moving content changes how complete the screen looks.
Google’s own explanation is in the Lighthouse Speed Index documentation.
What counts as a good score
Lighthouse groups the result into three bands on mobile:
| Speed Index | Rating |
|---|---|
| Up to 3.4 seconds | Good (green) |
| 3.4 to 5.8 seconds | Needs improvement (orange) |
| Over 5.8 seconds | Poor (red) |
Thresholds can change between Lighthouse versions, so check the report you are reading. Speed Index carries a smaller weight than other lab metrics in the performance score, which is why the score may be fine even if Speed Index is orange. If you want a broader view of how the score is built, read our guide to the PageSpeed Insights report.
How Speed Index relates to other metrics
Speed Index overlaps with several other measurements, but each one has a different focus:
- First Contentful Paint marks the first text or image. A slow FCP drags the whole curve to the right.
- Largest Contentful Paint marks the main element. Speed Index usually improves when LCP improves.
- Total Blocking Time shows how long scripts block the page. Heavy scripts can delay rendering and raise Speed Index.
- Cumulative Layout Shift measures movement. Late shifts can make the visual progress uneven.
Because Speed Index is a lab figure, treat it as a diagnostic aid. For ranking-related decisions, focus on the Core Web Vitals that Google measures on real visitors.
Common reasons for a high Speed Index
When the number is high, one of these causes is usually behind it:
- A slow server response. Nothing can be drawn before the HTML arrives.
- Render-blocking CSS and JavaScript. The browser waits for files before it paints. See how to eliminate render-blocking resources.
- A heavy hero image. A large photo at the top that loads late leaves the screen mostly empty.
- Client-side rendering. If the main content is built by JavaScript after the page loads, the visual progress is delayed.
- Web fonts that hide text. Invisible text until the font arrives makes the page look unfinished.
- Sliders and autoplay video. Large moving elements at the top delay a stable picture. See sliders and carousels.
How to improve Speed Index
Work from the top of the page down, and take the changes that give the biggest visible effect first:
- Speed up the first response. Use page caching, a modern PHP version and good hosting. See reducing server response time.
- Inline critical CSS. Put the styles for the top of the page into the HTML and load the rest later, as described in critical CSS explained.
- Defer scripts. Load non-essential JavaScript after the page is visible.
- Prioritise the main image. Use a properly sized modern format and mark the hero image as high priority. See the fetchpriority attribute.
- Do not lazy-load the top. Lazy loading helps images below the fold, but it delays images that are visible at once.
- Tame web fonts. Show fallback text first and swap in the final font. Read web font performance.
- Render on the server. Make the main content available in the first HTML response where you can.
Test after each change. Some fixes reduce one metric and raise another, so keep notes of the numbers. A typical example is inlining too much CSS: the first paint comes sooner, but the HTML grows and the server response feels slower. Aim for a balance, and verify it with repeated runs on the mobile profile, which is the stricter test and the one most visitors resemble.
Reading the filmstrip
PageSpeed Insights and Lighthouse show a filmstrip of screenshots taken during the load. This is the best tool for understanding Speed Index. Look for the moment when the first meaningful content appears and for long gaps between frames. A blank first third of the strip points to server, CSS or script problems. A page that looks complete early but changes late points to layout shifts or late images. Take screenshots of the strip before and after a change, so that you can show the difference to a client or colleague without explaining the numbers. Scores vary between runs, so run the test several times and compare medians; see why PageSpeed scores fluctuate.
What to expect on different kinds of sites
The same fix can have a different effect depending on what kind of site you run:
- Blogs and brochure sites. These are mostly text and a few images, so a good server response, a light theme and a properly sized header image are enough to reach the green band.
- Shops. Product grids load many images at once. Make sure only the first row loads eagerly, serve responsive sizes and avoid heavy scripts for pop-ups and reviews at the top.
- Page-builder sites. Builders often add large CSS and JavaScript files and deep layouts. Remove unused widgets and choose lighter templates for landing pages.
- Single-page applications. Pages built entirely in the browser show an empty frame until the scripts finish. Server-side rendering or pre-rendering the first screen gives the biggest gain.
Whatever the type, set a target and a budget. For example, you may decide that the home page must stay below a certain Speed Index on mobile and that every new plugin or script must be tested against it before launch. Small teams that agree on a number notice regressions early, before visitors do.
How Site AI Audit helps
Site AI Audit reports Google’s mobile PageSpeed score with LCP, CLS and INP, plus how long your server takes to respond, which pages took over two seconds to load during the crawl and the total weight of the home page. Use PageSpeed Insights to see the Speed Index itself, then run a free check to find the causes that slow the top of your pages. The pricing page lists plans with unlimited re-checks after each fix.
Related reading
- Why Your Website Is Slow on Mobile and How to Fix It
- PageSpeed Insights vs GTmetrix vs WebPageTest: Which to Use
- Website Speed Checklist: 30 Checks Before and After Launch
- Performance Budgets: How to Keep a Fast Website Fast
The bottom line
Speed Index rewards pages that show useful content early. Treat it as a helpful lab indicator: improve the server response, remove blocking code, load the main image first and avoid delaying what visitors see at the top. Check the filmstrip, test several times and keep your attention on the metrics that Google measures with real visitors.
GYIK
Is Speed Index a Core Web Vital?
No. The Core Web Vitals are LCP, INP and CLS, which Google measures on real visitors. Speed Index is a lab metric reported by Lighthouse and helps you diagnose perceived loading speed.
What is a good Speed Index?
On mobile in Lighthouse, up to about 3.4 seconds is rated good and above about 5.8 seconds is poor. Desktop tests are faster, so judge each device against its own thresholds.
Why is my Speed Index high while LCP is good?
The main element may appear on time while the rest of the visible area fills in late. Check the filmstrip for late images, fonts, banners or sections rendered by JavaScript.
Does Speed Index affect Google rankings?
Not directly. Google uses field data for Core Web Vitals in its page experience signals. A lower Speed Index usually goes together with a faster, better experience, which helps visitors.
Why does Speed Index change between tests?
Network conditions, server load, third-party scripts and test machines vary. Run the test several times and compare the median to see real changes.