ENEnglish
 LTLietuviškai
 DEDeutsch
 FRFrançais
 RUРусский
 ESEspañol
 PLPolski
 ITItaliano
 UKУкраїнська
 CSČeština
 PTPortuguês
 JA日本語
JA日本語 LVLatviešu valoda
 ETEesti
 HUMagyar
 IDBahasa Indonesia
 TRTürkçe
 HIहिन्दी
 ELΕλληνικά
 ARالعربية
 THไทย
THไทย VITiếng Việt
 RORomână
 MSBahasa Melayu
 BNবাংলা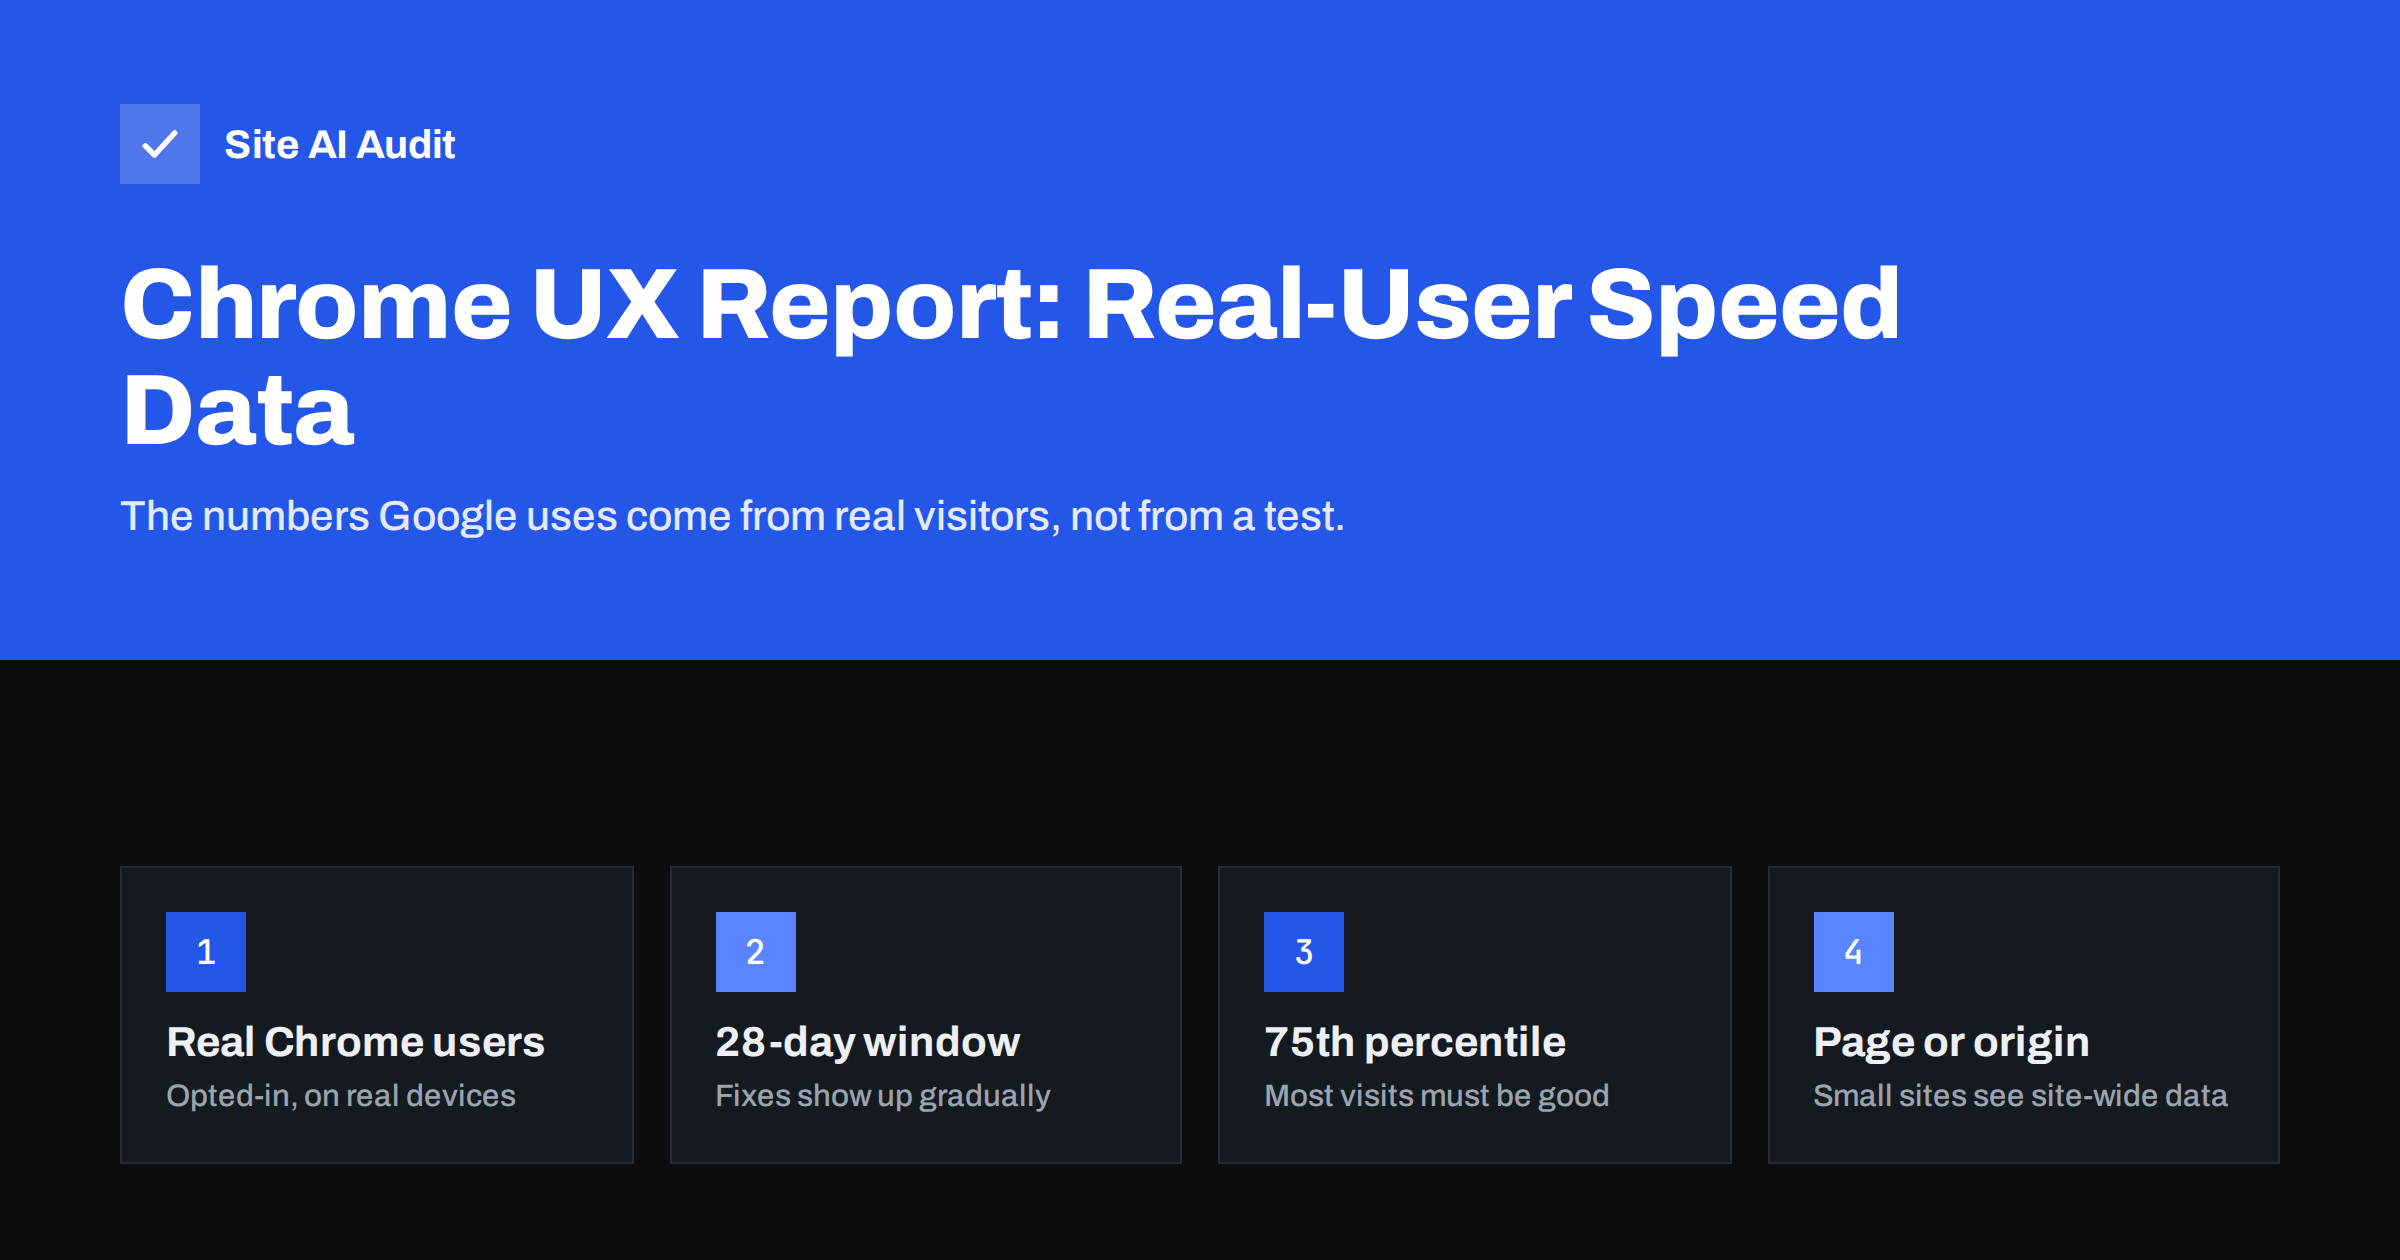
Short answer: The Chrome UX Report (CrUX) is Google’s public dataset of how real Chrome users experience websites: how fast pages load, how quickly they respond and how much they shift. It is the “field data” shown at the top of PageSpeed Insights and the source of the Core Web Vitals report in Search Console. It covers a rolling 28-day period and is judged at the 75th percentile, so improvements appear gradually, and pages with little traffic may show site-wide data or none at all.
Lab data vs field data
There are two fundamentally different ways to measure speed.
- Lab data comes from a test: one simulated device, one simulated network, one page load. Lighthouse, the lower part of PageSpeed Insights and most online speed testers produce lab data. It is repeatable and great for diagnosing problems, but it is not what your visitors actually experienced.
- Field data comes from real visits: real phones and laptops, real networks, real behaviour such as scrolling and clicking. It captures variety that no lab test can simulate, but it is aggregated over time and cannot tell you exactly why something is slow.
CrUX is the best-known source of field data, and the one Google uses when it talks about Core Web Vitals in search. If you have ever wondered why PageSpeed Insights shows a good score but “failed” Core Web Vitals, or the other way round, the difference between these two kinds of data is usually the answer. Our guide to reading a PageSpeed Insights report shows where each part appears.
How CrUX data is collected
CrUX data comes from Chrome users who have opted in to sharing usage statistics and meet certain conditions set by Google, such as syncing their browsing history. When those users visit a page, Chrome records metrics such as Largest Contentful Paint, Interaction to Next Paint and Cumulative Layout Shift, and reports them anonymously.
A few consequences follow from this method:
- Only Chrome is included. Visitors using Safari, Firefox and other browsers are not counted. On sites where most visitors use iPhones, CrUX describes only part of your audience.
- Only public pages are included. Pages that are not publicly discoverable, such as those behind a login, are generally excluded.
- Enough traffic is required. Google only publishes data for pages and origins with a sufficient number of eligible visits, to protect privacy and keep the numbers meaningful.
- Devices are separated. Phone and desktop experiences are reported separately, because they are often very different.
Google’s own CrUX documentation describes the eligibility rules and the available datasets in more detail.
The 28-day window and the 75th percentile
Two design choices explain most of the confusion around CrUX numbers.
The 28-day rolling window. The data shown in PageSpeed Insights and Search Console summarises the previous 28 days. When you deploy a fix, new visits are measured with the fix, but the old slow visits are still in the window. The average improves day by day and only fully reflects the change after about four weeks. This is why people often think a fix “did nothing” when it simply has not had time to show.
The 75th percentile. A page is assessed by the value that 75% of visits meet or beat. If LCP is 2.1 seconds at the 75th percentile, three-quarters of visits had an LCP of 2.1 seconds or faster. This deliberately focuses on most visitors, including those on slower phones, rather than on the best case. Improving only for fast devices will not move the number much.
The same design also means that field data can change without any change to your website. If a campaign brings many visitors on older phones or slow mobile networks, or if a new market starts visiting from far away, the 75th-percentile values can get worse even though the code is identical. The reverse can happen too. Before reacting to a shift in CrUX numbers, check whether your traffic mix changed in the same period, for example in your analytics by device, country or source. A change that matches a deployment date is far more likely to be caused by the site itself.
Core Web Vitals thresholds in CrUX
| Metric | Good | Needs improvement | Poor |
|---|---|---|---|
| Largest Contentful Paint (LCP) | 2.5 s or less | 2.5–4.0 s | More than 4.0 s |
| Interaction to Next Paint (INP) | 200 ms or less | 200–500 ms | More than 500 ms |
| Cumulative Layout Shift (CLS) | 0.1 or less | 0.1–0.25 | More than 0.25 |
A page or origin passes the Core Web Vitals assessment when all three metrics are “good” at the 75th percentile. CrUX also reports supporting metrics such as First Contentful Paint and Time to First Byte, which help explain slow LCP. For the meaning of each metric, see Core Web Vitals explained.
Page-level vs origin-level data
CrUX can report data for a single URL or for a whole origin, such as https://www.example.com. Busy pages have their own page-level data. Pages with too few visits do not, and PageSpeed Insights then shows the origin’s data instead, with a note saying so.
For small business sites this is common. Your home page may have its own data, while a service page with a few dozen visits a month shows the site-wide figure. That means fixing one quiet page will not change its field result at all; the origin score only moves when enough of the site improves.
Search Console takes a different approach. Its Core Web Vitals report groups similar URLs, for example all blog posts using one template, and shows their status together. The walkthrough of the Core Web Vitals report in Search Console explains how to use those groups to find the templates worth fixing.
Where to see CrUX data
- PageSpeed Insights. The top section, “Discover what your real users are experiencing”, is CrUX data for the URL or origin.
- Search Console. The Core Web Vitals report shows URL groups from CrUX over time, for mobile and desktop.
- CrUX API and History API. For developers and agencies who want to pull data automatically or chart it over many weeks.
- Public BigQuery dataset. A monthly origin-level dataset for large-scale analysis and comparisons.
- Visualisation tools from Google. Google provides a free visualisation tool for CrUX history; the specific tool has changed over the years, so check the current CrUX documentation.
When there is no CrUX data
New sites and low-traffic sites often see “no data” or “not enough real-user data”. This does not mean the site is slow or that it is penalised; it simply means there is not enough Chrome traffic to publish statistics.
In that case:
- Use lab tests to find and fix obvious problems: heavy images, render-blocking files, slow server response.
- Test on a real mid-range phone over a mobile connection, not only on a desktop.
- Consider collecting your own real-user data with a small script such as Google’s open-source web-vitals library, sending results to your analytics.
- Check again later; as traffic grows, origin-level data usually appears first.
Using CrUX well
Field data tells you whether there is a problem and how big it is for real visitors. Lab data tells you why. A sensible workflow uses both:
- Start from CrUX or Search Console to see which metric fails and on which device type.
- Use lab tools and browser developer tools on representative pages to find the cause.
- Fix, deploy and confirm the improvement in lab tests immediately.
- Wait for the 28-day window to roll over before judging the field result.
- Keep watching, because new plugins, scripts and content can undo a fix. The guide to website speed monitoring covers how to catch slowdowns early.
Our comparison of PageSpeed Insights, GTmetrix and WebPageTest explains which lab tool is best for which diagnosis.
How Site AI Audit helps
Site AI Audit includes a Google PageSpeed measurement of mobile speed and Core Web Vitals in every website check, together with server response time, compression, page weight, SEO, SSL, security headers and e-mail authentication. Findings are explained in plain words and ranked by impact. Paid plans on the pricing page add re-checks after each fix and monitoring, which fits well with the slow, 28-day rhythm of field data.
Related reading
- Does Page Speed Affect Google Rankings? What We Actually Know
- Interaction to Next Paint (INP): How to Fix Slow Interactions
- How Agencies Should Report Website Speed to Clients
The bottom line
CrUX is the record of what real Chrome users experienced on your site over the last 28 days, judged at the 75th percentile. It is the data Google uses for Core Web Vitals, so it matters more than any single lab score. Use it to decide what to fix, use lab tools to find out how, and give your improvements a few weeks to show up in the field numbers.
GYIK
Why does PageSpeed Insights show different lab and field results?
Lab data comes from one simulated test, while field data from CrUX summarises real visits over 28 days on many devices and networks. They measure different things, so they often disagree.
How long until a speed fix shows in CrUX?
The data covers a rolling 28-day window, so improvements appear gradually and are fully reflected after about four weeks, provided the site has enough traffic.
Why does my page say there is not enough real-user data?
CrUX only publishes data when enough eligible Chrome users have visited. Low-traffic pages may show origin-level data instead, and very small sites may have none.
Does CrUX include Safari and iPhone users?
No. CrUX is collected from Chrome users only, so visitors using Safari and other browsers are not included in the data.
What is the 75th percentile in Core Web Vitals?
It is the value that three-quarters of visits meet or beat. A page passes when its 75th-percentile LCP, INP and CLS are all within the good thresholds.