ENEnglish
 LTLietuviškai
 DEDeutsch
 FRFrançais
 RUРусский
 ESEspañol
 PLPolski
 ITItaliano
 UKУкраїнська
 CSČeština
 PTPortuguês
 JA日本語
JA日本語 LVLatviešu valoda
 ETEesti
 HUMagyar
 IDBahasa Indonesia
 TRTürkçe
 HIहिन्दी
 ELΕλληνικά
 ARالعربية
 THไทย
THไทย VITiếng Việt
 RORomână
 MSBahasa Melayu
 BNবাংলা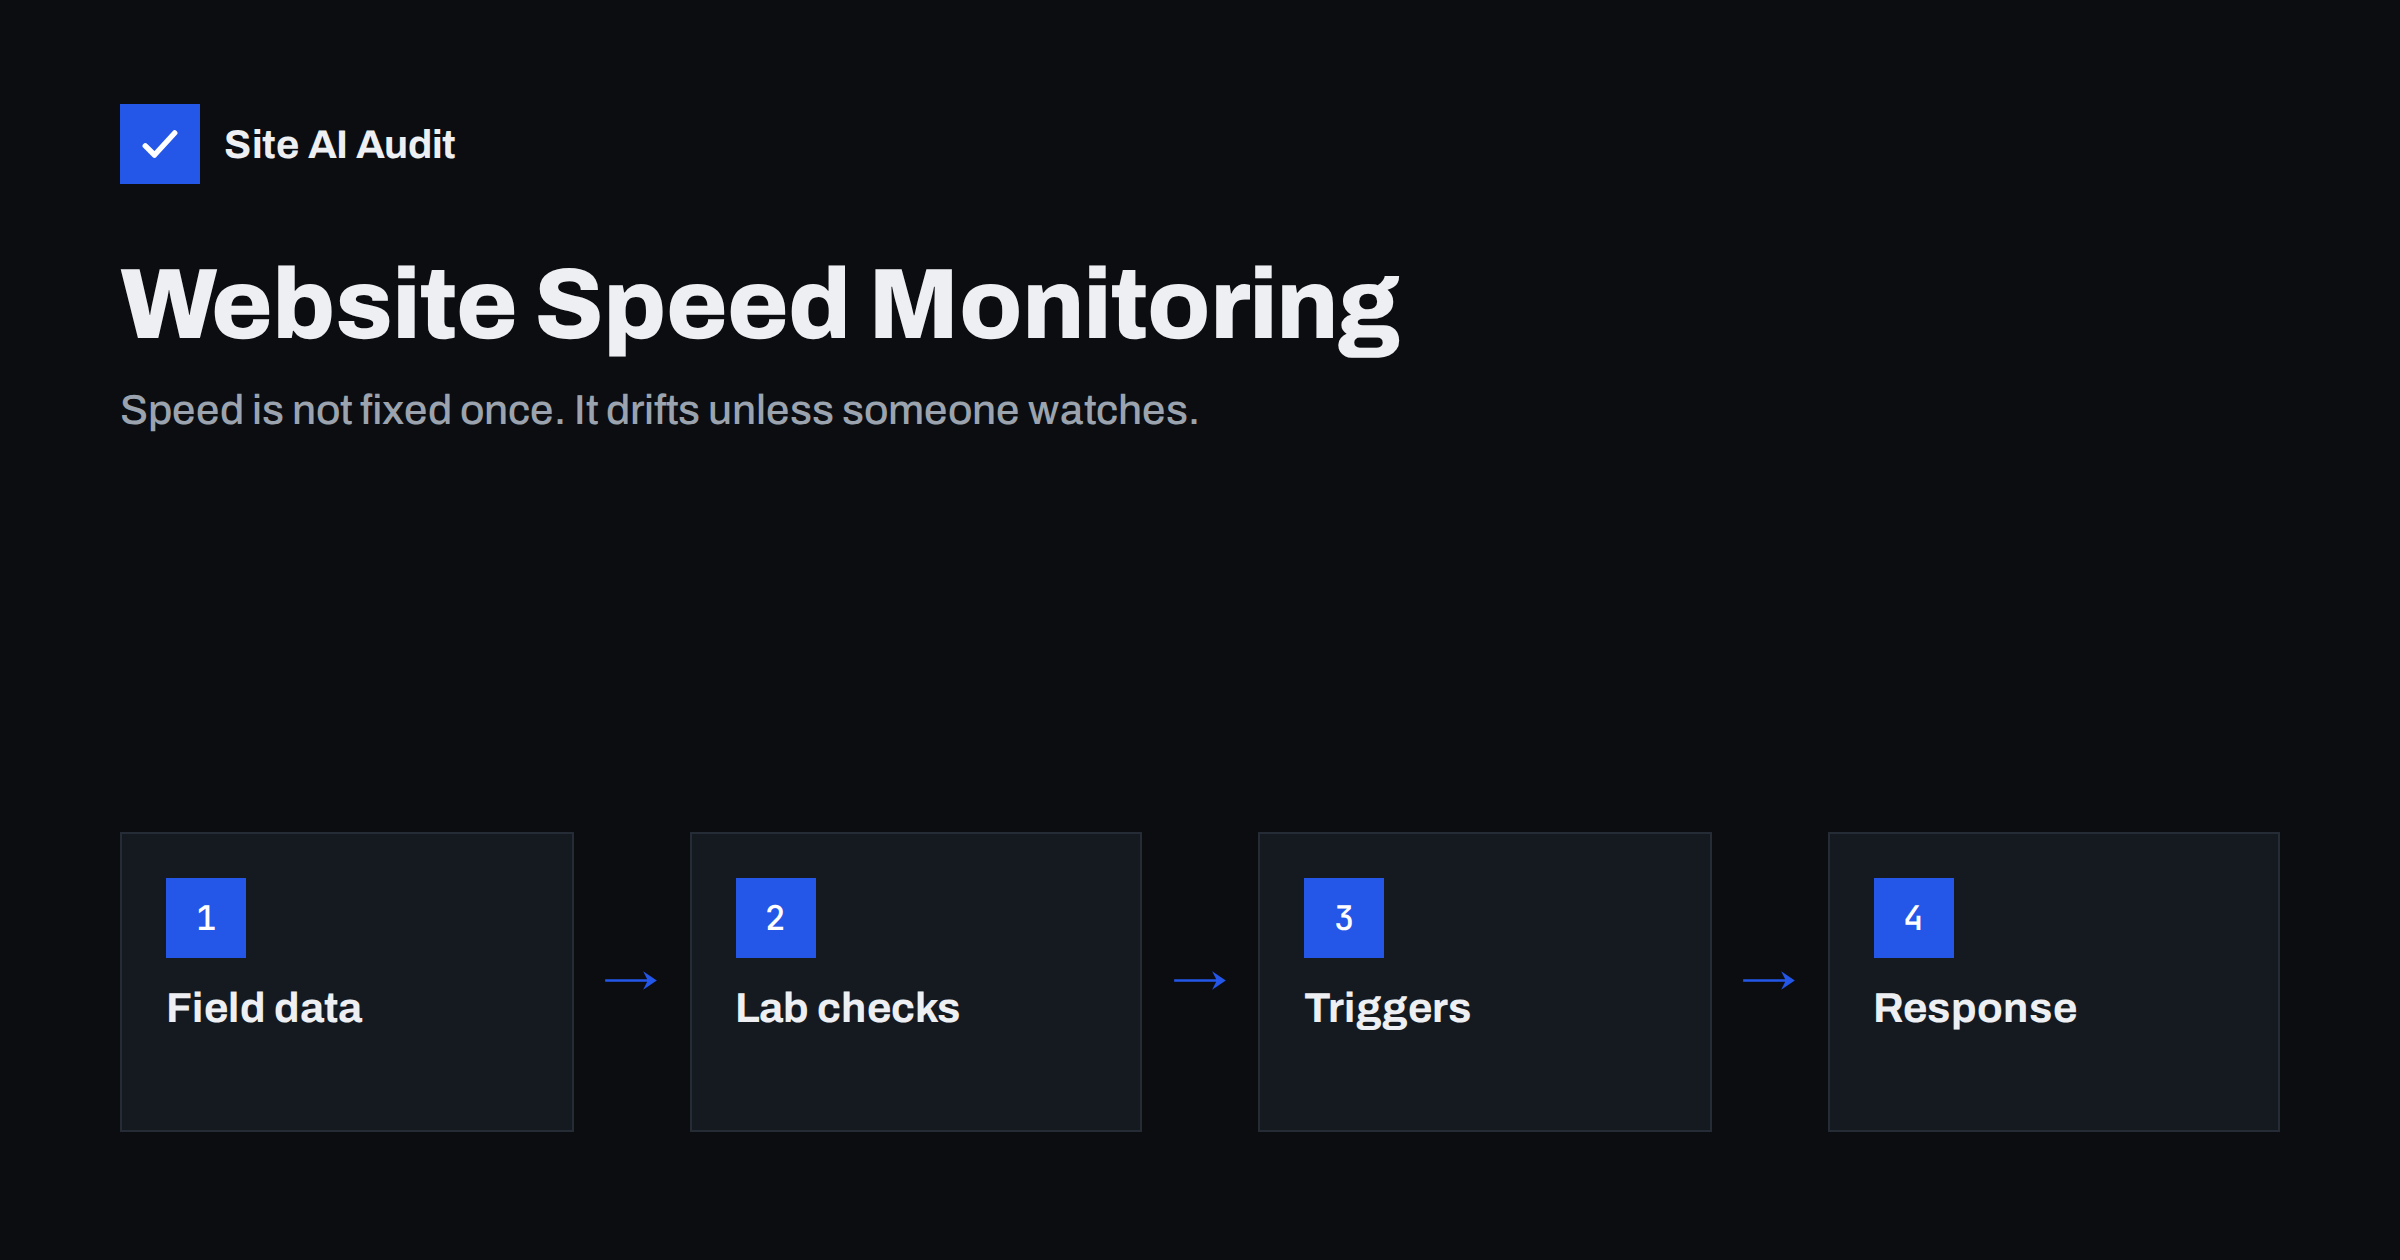
Short answer: Website speed monitoring means measuring the same key pages regularly with consistent settings, so you notice when they get slower and can link the change to its cause. A practical setup for a small business combines three things: a monthly look at real-user Core Web Vitals in Search Console, scheduled lab tests or audits of a handful of important pages, and an extra test after every change such as a plugin update, new tag or redesign. When a metric drops, compare the date with recent changes, find the cause and fix it before customers notice.
Speed work is often treated as a project: the site is slow, someone optimises it, the scores turn green, the project is closed. Six months later, the site is slow again. Nobody made a single bad decision; a new plugin here, a campaign tag there, a larger hero image, a theme update, a vendor’s heavier script. Monitoring turns speed from a one-off project into a property you maintain, like security updates or backups.
Why websites slow down over time
- New plugins and features, each adding scripts, styles and database queries.
- Marketing tags added for campaigns and never removed.
- Content growth: heavier images uploaded by editors, longer pages, more products.
- Theme and plugin updates that change how assets load.
- Third-party changes: vendors update their scripts without notice.
- Database growth slowing uncached requests.
- Hosting changes: busier shared servers, configuration changes, expired caches.
What to monitor
| What | Why | Source |
|---|---|---|
| Core Web Vitals (field) | What real visitors experience and what Google uses | Search Console, PageSpeed Insights |
| LCP, CLS, TBT (lab) | Fast feedback after changes | Lighthouse-based tests |
| सर्वर रिस्पॉन्स टाइम | Early warning for hosting or caching problems | Audits, uptime tools, lab tests |
| Page weight and requests | Catches heavy images and new scripts | Lab tests, audits |
| Availability and errors | A down or broken page is the slowest page of all | Uptime monitoring, audits |
Which pages to monitor
You do not need to monitor every page. Choose a small, stable set that represents your templates and business:
- the home page;
- your most important landing page for campaigns or search;
- a typical blog post or article;
- for shops: a category page, a product page and the cart;
- for service businesses: the main contact or booking page.
Keep the list the same over time, so trends are comparable. Add pages when you launch new templates.
How often to check
- After every significant change: plugin installs and updates, theme updates, new tags, redesigns, hosting changes. This is the most valuable check because the cause is obvious.
- Weekly: automated lab tests or audits of your key pages, to catch changes you did not make yourself.
- Monthly: review field data in Search Console’s Core Web Vitals report and PageSpeed Insights. Field data moves slowly, so monthly is enough.
- Quarterly or twice a year: a broader review of plugins, tags and page weight across the site.
Tools for monitoring
- Google Search Console: free, site-wide field data grouped by URL type, with e-mail notifications when new Core Web Vitals issues appear.
- PageSpeed Insights: quick manual checks of field and lab data for individual pages.
- Scheduled lab testing tools: several services run tests on a schedule and keep history, which makes trends visible.
- Real-user monitoring: for larger sites, collecting Core Web Vitals from your own visitors with a small script gives detailed data per page and device.
- Website audits: regular audits that combine speed with other checks catch related issues, such as an expiring certificate or broken pages, in the same report.
- Uptime monitoring: checks that the site responds at all, often every few minutes.
Keeping measurements comparable
Monitoring is only useful if a change in the numbers means a change in the site. Keep the conditions stable:
- Use the same tool, location, device profile and connection settings.
- Test the same URLs.
- Run several tests and use the median, or rely on tools that do this for you.
- Note known events such as campaigns, big content launches or hosting maintenance next to the data.
- Treat small fluctuations as noise; look for sustained changes over several measurements.
What to do when speed drops
- Confirm it. Re-run the test a few times. One bad result may be noise.
- Find the date. When did the change start? Compare with your change log: updates, new plugins, tags, content.
- Find the metric. Is it server response (hosting, caching, database), LCP (images, render-blocking), CLS (new banners or embeds) or TBT/INP (scripts)?
- Find the cause. Use the waterfall and DevTools to compare with an older test.
- Fix or roll back, then confirm with the same test settings.
- Record what happened, so the same problem is recognised quickly next time.
Keeping a change log
The single most useful companion to speed monitoring is a simple change log: date, what changed, who changed it. It can be a shared spreadsheet or the notes field in your maintenance tool. When a graph shows a slowdown starting on a Tuesday, the log tells you that a new review widget went live that morning. Without it, teams spend hours testing theories. Agencies managing client sites benefit most, because several people often make changes to the same site.
Monitoring for different kinds of websites
The right level of monitoring depends on what the website does for the business. A small brochure site that changes a few times a year needs little more than the monthly field data review and a test after each update. A blog or news site that publishes several times a week should watch page weight closely, because every new article brings new images and embeds. An online shop should monitor its product, cart and checkout pages weekly, and test immediately after any change to plugins, payment methods or tracking, because slow checkouts cost money directly. Sites that run paid campaigns should test every new landing page before the campaign starts, since a slow landing page wastes the ad budget from the first click. Agencies with many client sites usually need a dashboard or regular audit reports that show all sites side by side, so problems stand out without opening each one.
What a useful monitoring report looks like
Whether you report to yourself, a manager or a client, keep the report short. A good monthly speed report fits on one page: the Core Web Vitals status on mobile from field data, a small table of the key pages with this month’s and last month’s lab values, a list of changes made during the month, and any action taken or planned. Avoid screenshots of long audit lists; they hide the few numbers that matter. If something got worse, say what caused it and what will be done. If everything is stable, say so in one sentence. Over time, this simple record becomes a valuable history of the site and makes it easy to show the effect of maintenance work.
Speed budgets and alerts
A speed budget sets limits for key metrics, for example a maximum LCP in lab tests for your landing page or a maximum page weight for the home page. Monitoring then becomes a simple question: is anything over budget? Some tools can alert you automatically when a budget is exceeded. Keep budgets realistic and based on your current good state, so alerts mean something and are not ignored.
How Site AI Audit helps
Site AI Audit checks speed as part of a complete website health report: Google PageSpeed for mobile with Core Web Vitals, server response time, compression and page weight, together with SEO, SSL, security headers and e-mail authentication. The first check is free. Paid plans add unlimited re-checks, weekly monitoring and e-mail alerts when something breaks, such as an expiring certificate or a broken page, plus report history on higher plans, which covers the weekly part of the routine above. See the plans.
Related reading
- PageSpeed Insights vs GTmetrix vs WebPageTest: Which to Use
- Website Speed Checklist: 30 Checks Before and After Launch
- How Third-Party Scripts Slow Down Your Website (and Fixes)
- SSL Certificate Monitoring: How to Never Miss an Expiry Again
The bottom line
Websites drift toward slowness unless someone watches. Monitor a small, fixed set of key pages with consistent settings, test after every change, review field data monthly and keep a change log. When speed drops, confirm it, match it to a change, fix the cause and record what happened. Monitoring costs little and keeps the benefit of every speed project you have already paid for.
FAQ
How often should I test my website speed?
After every significant change, plus automated checks of key pages weekly and a review of real-user data monthly. This catches both self-inflicted slowdowns and changes from third parties.
What is the best free tool for monitoring website speed?
Google Search Console is the best free source of real-user Core Web Vitals across your site, with notifications for new issues. PageSpeed Insights adds quick per-page checks. For scheduled lab tests with history, dedicated services or audit tools help.
Why does my website get slower over time?
New plugins, tags, heavier images, theme updates, third-party script changes and database growth accumulate. Each change may look small, but together they add up. Monitoring shows when and why it happens.
What is a speed budget?
A set of limits for metrics such as LCP, page weight or JavaScript size. Monitoring checks pages against these limits and flags when a change pushes a page over budget.
Should agencies monitor client websites?
Yes, especially when several people make changes. Regular checks with a change log help agencies spot problems early, explain them to clients and show the value of maintenance work.