ENEnglish
 LTLietuviškai
 DEDeutsch
 FRFrançais
 RUРусский
 ESEspañol
 PLPolski
 ITItaliano
 UKУкраїнська
 CSČeština
 PTPortuguês
 JA日本語
JA日本語 LVLatviešu valoda
 ETEesti
 HUMagyar
 IDBahasa Indonesia
 TRTürkçe
 HIहिन्दी
 ELΕλληνικά
 ARالعربية
 THไทย
THไทย VITiếng Việt
 RORomână
 MSBahasa Melayu
 BNবাংলা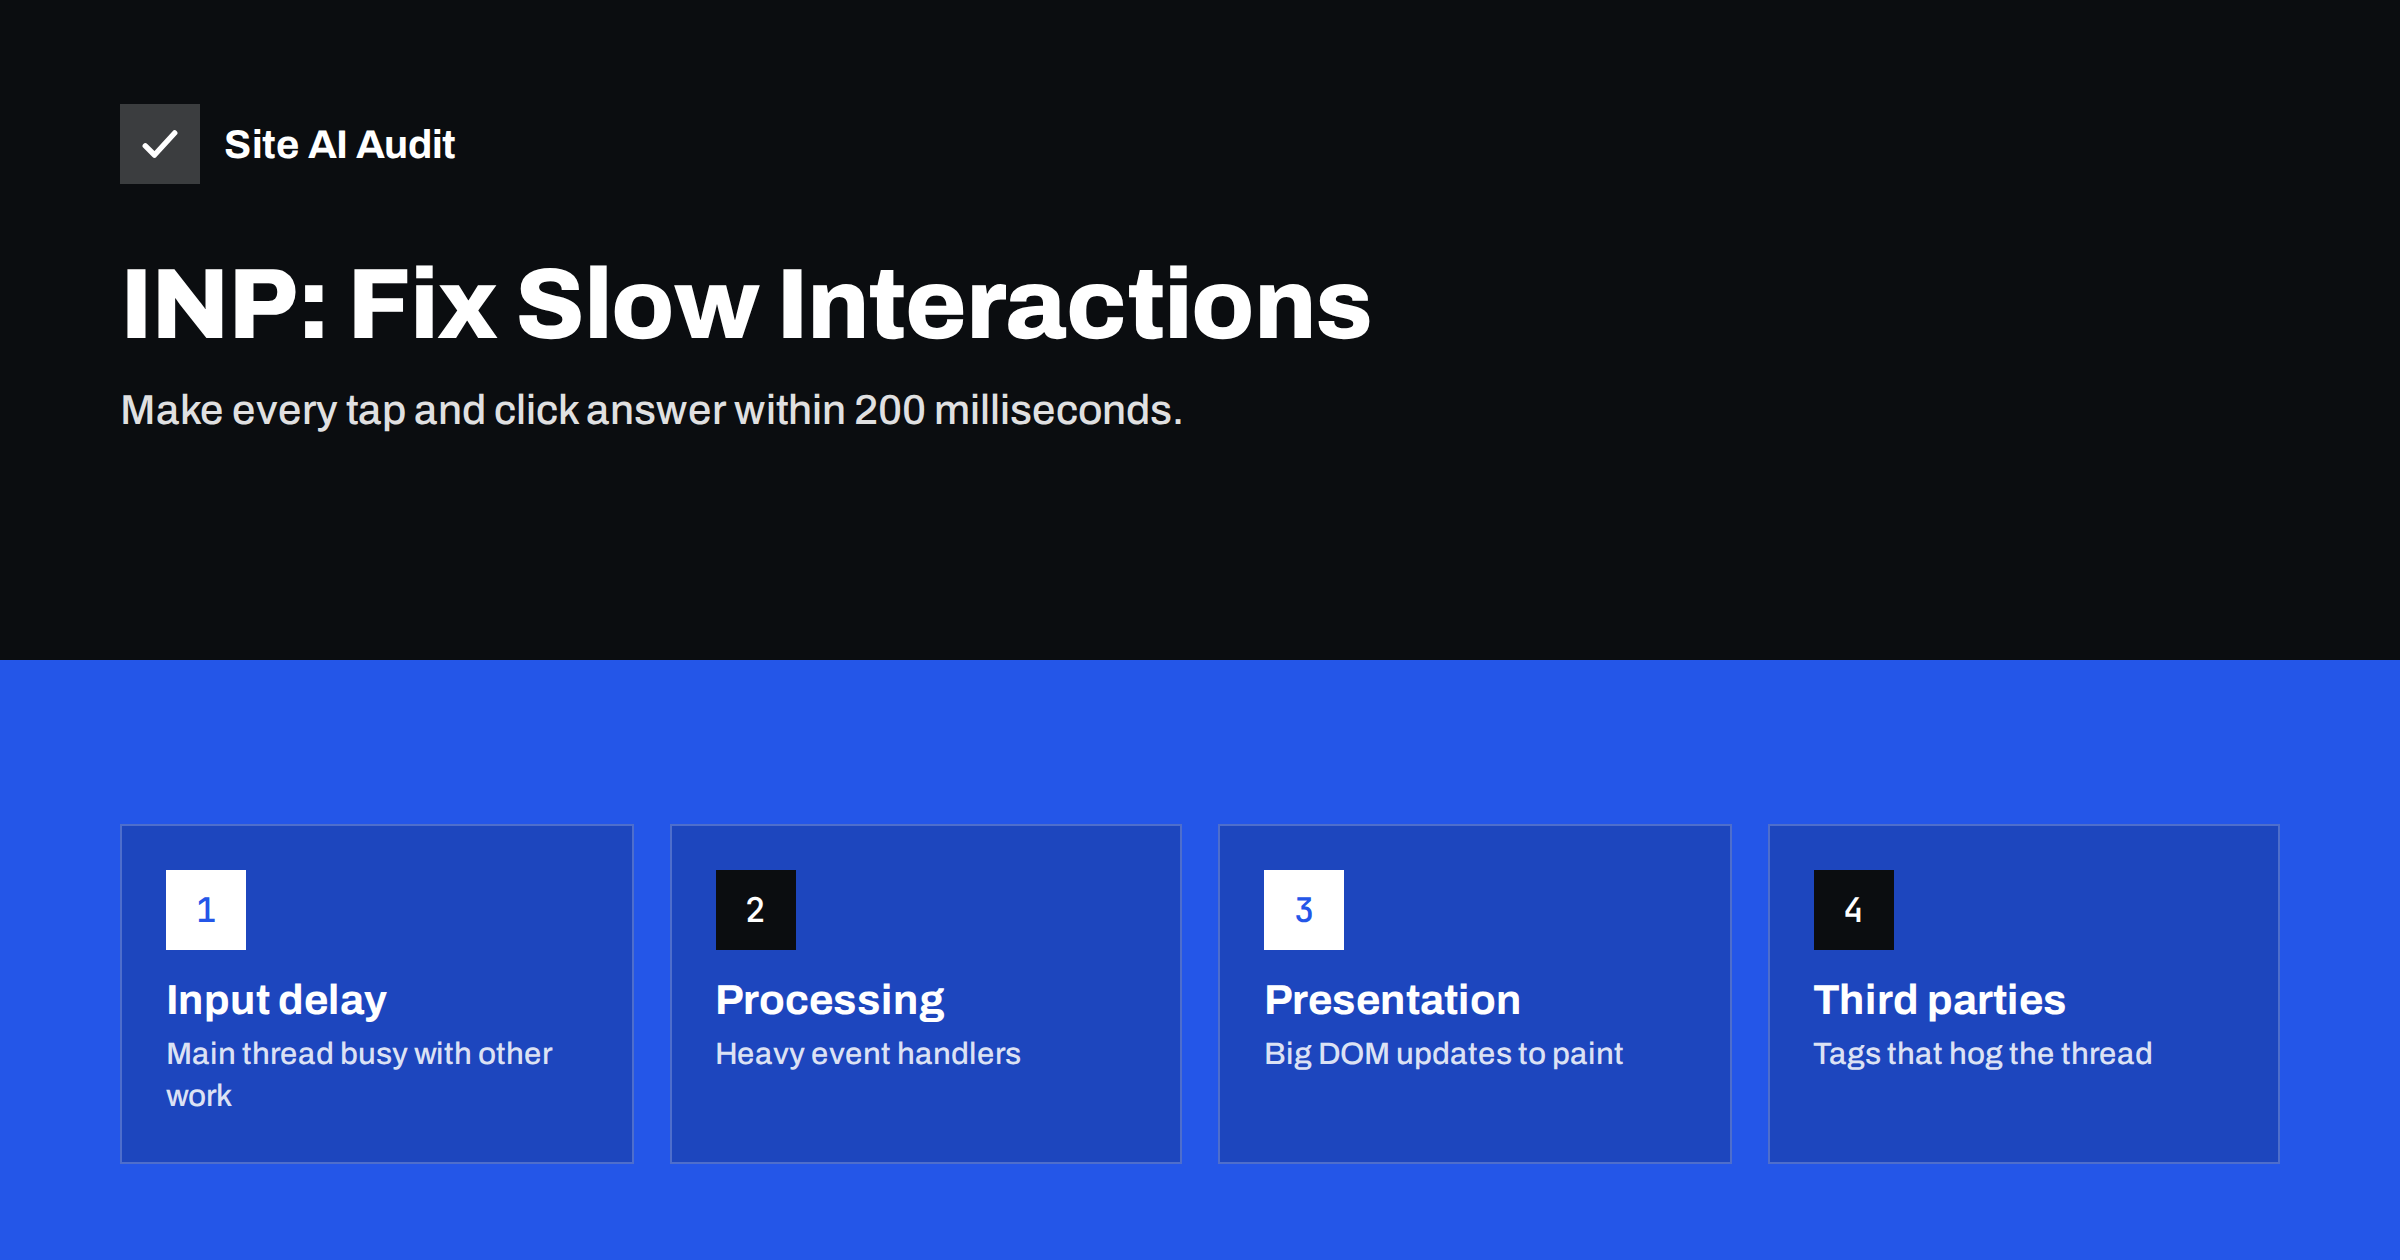
Short answer: Interaction to Next Paint (INP) measures how long a page takes to visually respond after a click, tap or key press, and reports one of the slowest interactions of the visit. It is good at 200 milliseconds or less. Poor INP is almost always caused by JavaScript keeping the browser’s main thread busy, so the fixes are to remove or delay unnecessary scripts, break long tasks into smaller pieces and make event handlers do less before updating the screen.
Visitors notice slow interactions immediately. They tap the menu button and nothing happens, so they tap again and the menu opens and closes. They choose a product filter and the page freezes for a second. None of this shows up in a simple load-time test, which is why Google added Interaction to Next Paint to the Core Web Vitals. For many sites that pass LCP and CLS easily, INP is the metric that remains in the red.
What INP measures
INP observes clicks, taps and keyboard presses throughout the whole visit, not only during loading. For each interaction, it measures the time from the user’s input until the browser paints the next frame showing a response. At the end of the visit, it reports the slowest interaction, or close to the slowest on pages with very many interactions, so a single outlier does not dominate.
- Good: 200 milliseconds or less
- Needs improvement: 200 to 500 milliseconds
- Poor: more than 500 milliseconds
INP became a Core Web Vital in March 2024, replacing First Input Delay (FID). FID only measured the delay before the first interaction started being processed, which most sites passed easily. INP is stricter because it includes the processing time and the time to paint, for every interaction.
Scrolling and hovering are not counted. Only discrete interactions are: pointer clicks, taps and key presses.
The three parts of an interaction
Every interaction can be split into three phases, and knowing which one is slow tells you what to fix:
| Phase | What happens | Typical cause when slow |
|---|---|---|
| Input delay | The input waits until the main thread is free | Other scripts running long tasks at that moment |
| Processing time | Event handlers for the interaction run | Heavy code in click, input or change handlers |
| Presentation delay | The browser recalculates styles, layout and paints | Large DOM, complex CSS, big content updates |
The browser’s main thread does almost everything: runs JavaScript, calculates layout and paints. While it is busy with one task, it cannot respond to the user. Any task that runs longer than 50 milliseconds is called a long task, and long tasks are the root of most INP problems.
How to find your slow interactions
Because INP depends on what users actually do, you need to find which interactions are slow and on which pages.
- Start with field data. PageSpeed Insights and the Core Web Vitals report in Search Console show whether INP is a problem and on which groups of URLs. Lab tests cannot measure INP directly.
- Look at Total Blocking Time in lab tests. TBT adds up the blocking part of long tasks during loading. A high TBT usually goes together with poor INP, especially for interactions shortly after load.
- Reproduce in Chrome DevTools. Open the Performance panel, enable CPU throttling to imitate a mid-range phone, and click through the typical actions: open the menu, use filters, add to cart, submit a form. The panel shows INP live and marks long tasks.
- Record and inspect. A performance recording shows exactly which script function ran during a slow interaction, and whether it belongs to your site or a third party.
- Consider real-user monitoring. For larger sites, a small script using Google’s open-source web-vitals library can report which element was interacted with when INP was slow.
Fix 1: Reduce and delay third-party scripts
On small-business and marketing sites, a large share of main-thread work often comes from scripts that the site owner did not write: tag managers, analytics, advertising pixels, heatmaps, chat widgets, review widgets, consent tools and social embeds.
- Make an inventory. List every third-party script and who needs it. Tags added for a campaign two years ago are often still there.
- Remove what nobody uses. This is the cheapest and most effective INP fix available.
- Load the rest later. Chat widgets, for example, can be loaded after a few seconds or on the first user interaction instead of during page load.
- Load them only where needed. A booking widget belongs on the booking page, not on every blog post.
Fix 2: Break up long tasks
If your own code runs long tasks, split them so the browser can respond to input in between. The general approach is to yield to the main thread regularly:
- Split large loops, such as processing hundreds of products, into chunks and let the browser breathe between them.
- Use
scheduler.yield()where supported, orsetTimeoutas a fallback, to hand control back to the browser. - Move heavy computation that does not touch the page, such as data processing, into a Web Worker.
- Avoid running large initialisation code for components that are not visible yet.
Fix 3: Make event handlers do less
When a user clicks, the handler should update the screen first and do the rest afterwards.
- Give immediate visual feedback. Show the menu, the spinner or the pressed state before starting expensive work such as fetching data or sending analytics events.
- Defer non-visual work. Analytics calls, logging and saving state can run after the next paint.
- Debounce input handlers. Search-as-you-type and live filters should not re-render the whole list on every key press.
- Avoid layout thrashing. Reading layout values and then writing styles repeatedly in a loop forces the browser to recalculate layout many times.
Fix 4: Reduce presentation delay
Even after the code finishes, the browser must update styles and layout and paint the result. On pages with a very large DOM, this step itself can be slow.
- Keep the DOM smaller. Page builders often wrap each element in many nested containers; mega menus and long product grids can add thousands of nodes.
- Update only what changed instead of re-rendering entire sections.
- Use
content-visibility: autofor long pages, so the browser skips rendering work for off-screen sections. - Avoid rendering large amounts of HTML in one go in response to a click; paginate or virtualise long lists.
INP on WordPress and shop sites
WordPress sites commonly struggle with INP because of page builders, sliders, heavy themes and plugin scripts loaded on every page. Shops add product filters, variation selectors, cart fragments and many marketing tags. Practical steps that often help:
- Disable plugin scripts on pages where the feature is not used.
- Replace JavaScript-heavy sliders and animations with static content or CSS.
- Review the tag manager container and remove duplicate or outdated tags.
- Test filters and variation selectors on a throttled CPU, not only on a fast laptop.
Be careful with “delay JavaScript” features in optimisation plugins. They can improve loading metrics by postponing scripts until the first interaction, but then the first tap has to wait while all those scripts load and run at once, which can make INP worse. If you use such a feature, exclude the scripts that power menus, buttons and forms, and measure the first interaction on a throttled phone profile. The goal is not to hide JavaScript cost from a test tool but to reduce the amount of work the visitor’s device has to do.
How Site AI Audit helps
Site AI Audit includes Google PageSpeed for mobile in every check and reports INP alongside LCP and CLS, plus server response time and page weight. When INP needs attention, the report explains the likely cause and how to approach the fix in plain words, ranked by impact against your SEO, security and e-mail findings. Run a free check to see where your site stands.
Related reading
- Core Web Vitals Explained for Small Business Websites
- How to Improve Largest Contentful Paint (LCP) on Any Website
- How to Fix Cumulative Layout Shift (CLS) on Your Website
The bottom line
INP is about the main thread being free when the user needs it. Remove scripts you do not need, load third-party tools later and only where they are used, split long tasks, and make every interaction update the screen before doing anything else. Test on a slow phone profile, because that is where INP problems live.
FAQ
What is a good INP score?
INP is good at 200 milliseconds or less, needs improvement between 200 and 500 milliseconds and is poor above 500 milliseconds. Google assesses it at the 75th percentile of real visits. Mobile and desktop are evaluated separately.
Why can’t Lighthouse measure INP?
INP needs real user interactions, and a standard lab test only loads the page without clicking anything. Lighthouse reports Total Blocking Time instead, which correlates with INP. To measure INP in the lab, interact with the page yourself in Chrome DevTools.
What is the difference between INP and FID?
First Input Delay only measured the waiting time before the first interaction was processed. INP covers all interactions during the visit and includes processing and painting time. INP replaced FID as a Core Web Vital in March 2024.
Do chat widgets affect INP?
They can, because many chat widgets load a significant amount of JavaScript that runs on the main thread. Loading the widget a few seconds after the page or on the first interaction usually reduces its impact. Measure before and after to confirm.
Does better hosting improve INP?
Rarely. INP depends on what happens in the visitor’s browser, mainly JavaScript execution on their device. Faster hosting helps loading metrics like LCP, but reducing and optimising scripts is what improves INP.