ENEnglish
 LTLietuviškai
 DEDeutsch
 FRFrançais
 RUРусский
 ESEspañol
 PLPolski
 ITItaliano
 UKУкраїнська
 CSČeština
 PTPortuguês
 JA日本語
JA日本語 LVLatviešu valoda
 ETEesti
 HUMagyar
 IDBahasa Indonesia
 TRTürkçe
 HIहिन्दी
 ELΕλληνικά
 ARالعربية
 THไทย
THไทย VITiếng Việt
 RORomână
 MSBahasa Melayu
 BNবাংলা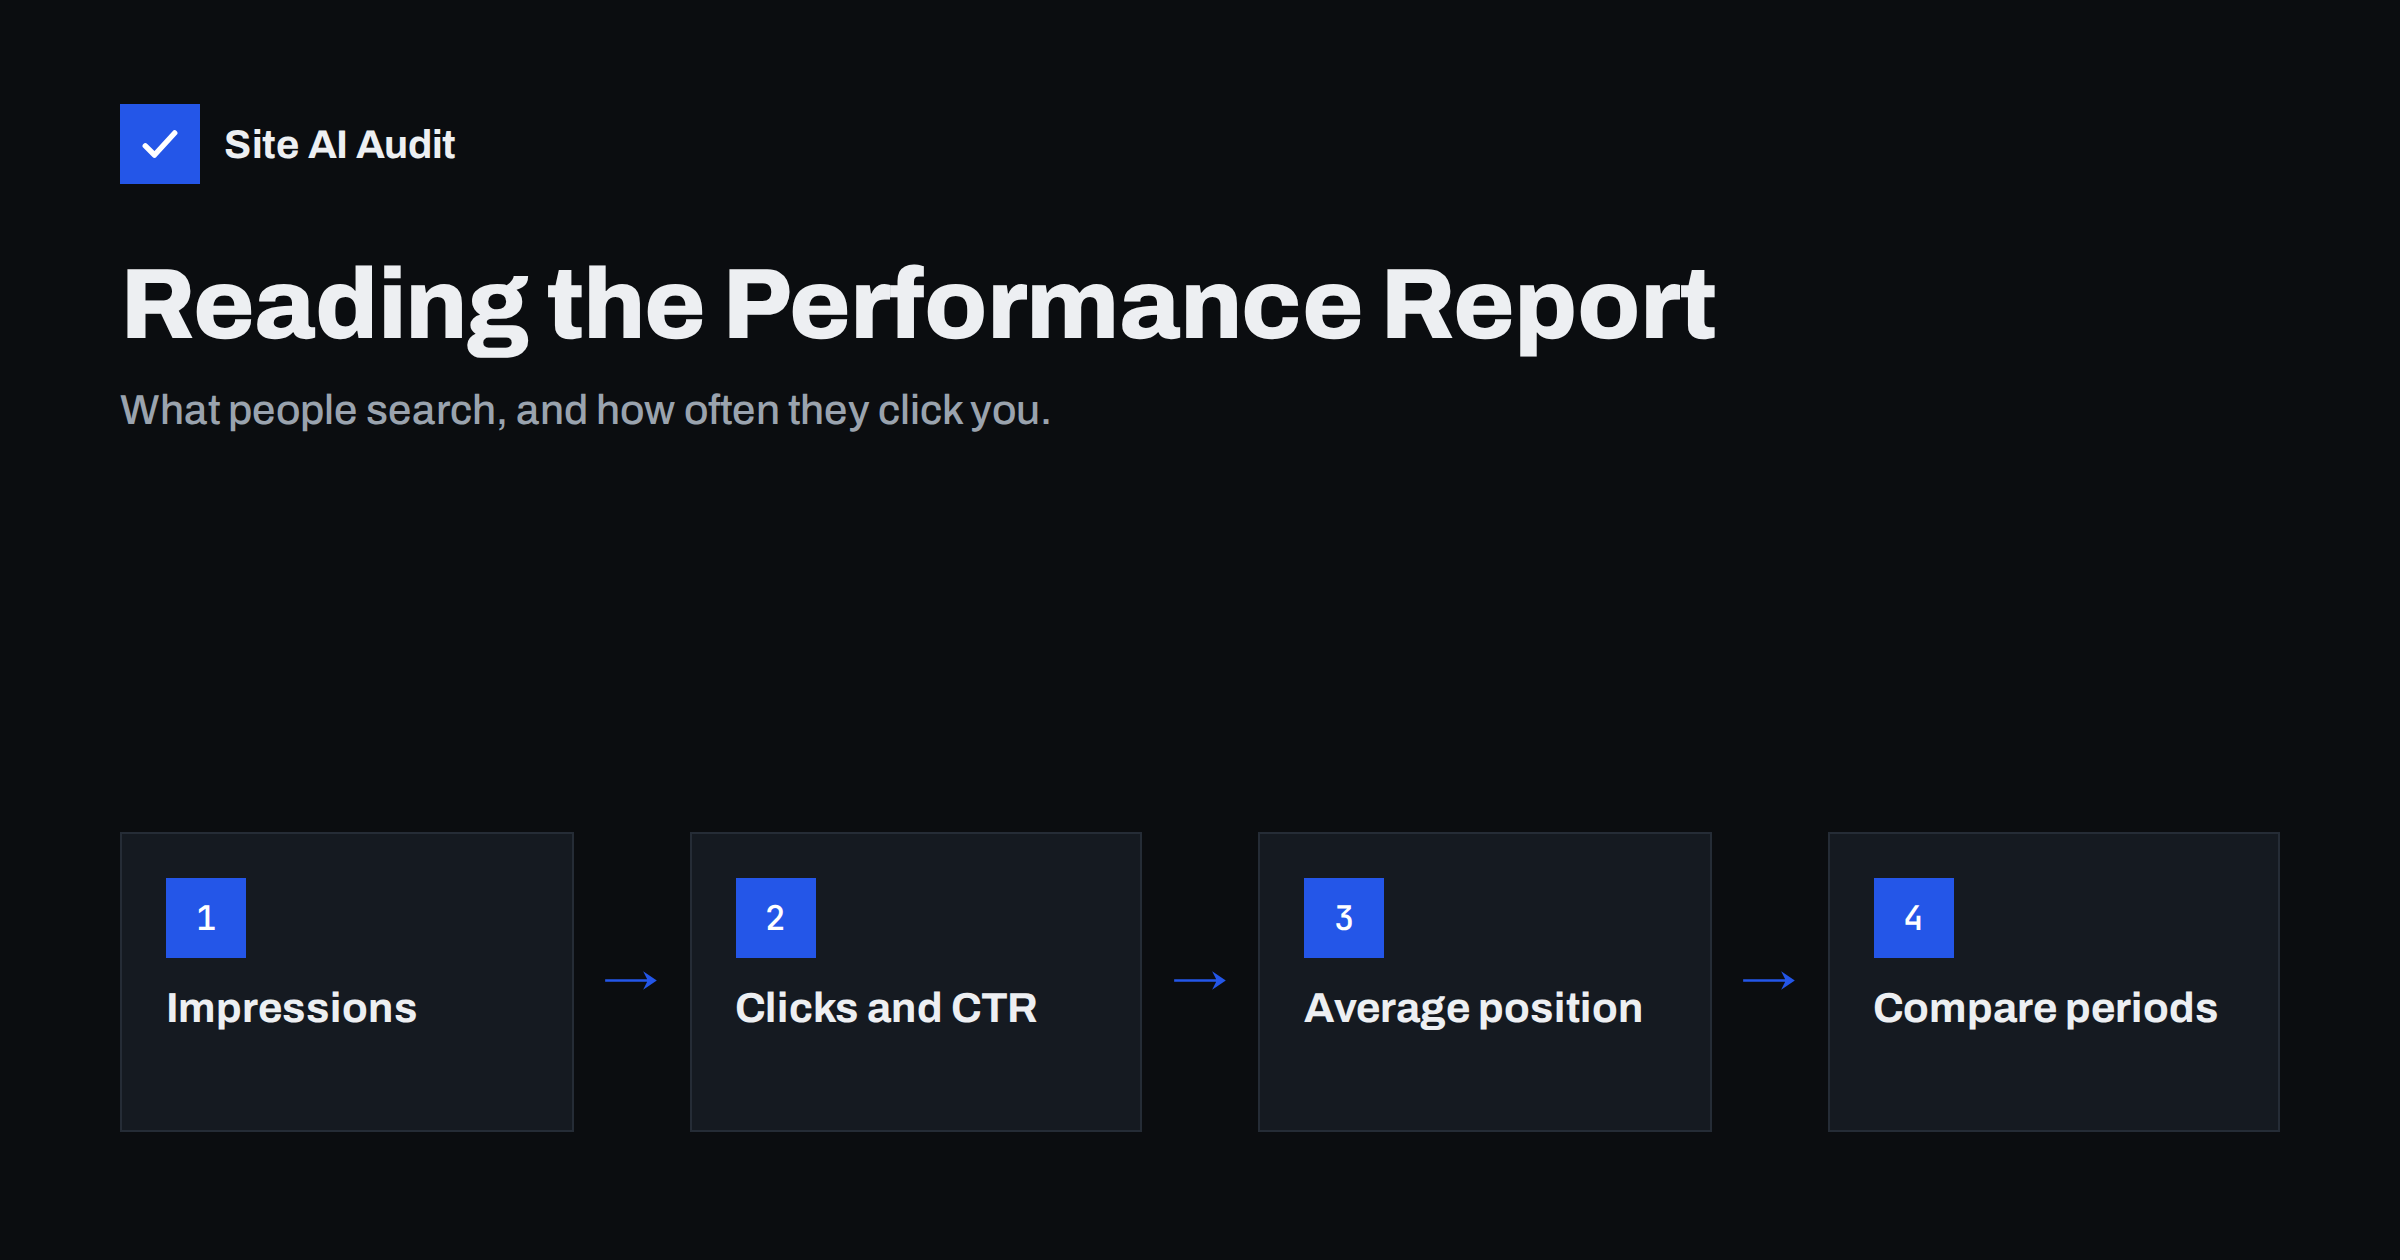
Short answer: The Performance report in Google Search Console shows how your site appears in Google Search: which queries and pages earned impressions, how many clicks they got, the click-through rate (CTR) and the average position. Read it by filtering and comparing: look at one page or query at a time, compare periods of equal length, and look for pages with many impressions but few clicks, queries you did not expect and sudden changes. Average position is useful per query, but misleading as a site-wide number.
Where to find the report
Open Google Search Console, select your property, and choose “Search results” under Performance in the left menu. By default, it shows the last three months of web search data. You can switch the date range up to 16 months, and change the search type to image, video or news if those matter for your site.
At the top are four metric boxes you can switch on or off. Below is a chart over time, and below that a table with tabs for Queries, Pages, Countries, Devices, Search appearance and Dates. Almost everything useful comes from combining these tabs with filters.
The four metrics in plain words
- Impressions count how many times a link to your site appeared in search results that a user saw or could have seen. A page listed on the second page of results that the searcher never opened usually does not count.
- Clicks count how many times people clicked through to your site from those results.
- CTR (click-through rate) is clicks divided by impressions. A CTR of 5% means one click for every twenty impressions.
- Average position is the average ranking of your highest result for each query, weighted by impressions. Position 1 is the top.
The numbers are related. Higher positions usually earn more impressions and a higher CTR. But the relationship varies enormously by query, because results pages differ: some are full of ads, maps, videos or answer boxes that take attention away from standard links.
Why average position can mislead
A site-wide average position mixes very different searches. If your site ranks first for your brand name and forty-fifth for a hundred loosely related phrases, the average could look poor even though the important searches are fine. Likewise, if you start appearing for many new queries at low positions, the average drops while your visibility is actually growing.
Use average position mainly at the level of a single query, or a single query and page combination. There, it is a helpful signal of where you stand and whether you are moving.
Five questions the report can answer
1. Which searches bring people to my site? Open the Queries tab, sort by clicks, and read the list. It often contains wording you never used on the site, which is valuable for titles, headings and new content.
2. Which pages attract search visitors? Open the Pages tab and sort by clicks. The pages at the top are the ones to protect in any redesign or migration.
3. Where am I close to page one? Filter for queries with an average position between about 5 and 20. These are often the best opportunities: modest improvements to content, titles or internal links can move them into positions with far more clicks.
4. Which listings are shown but not clicked? Sort pages or queries by impressions and look for low CTR compared with similar positions. A vague title, an unhelpful description, or a mismatch between the query and what the page offers are common reasons.
5. What changed, and when? Use the Compare option in the date filter, for example the last 28 days against the previous 28 days, or against the same period last year for seasonal businesses. Then look at which pages and queries gained or lost the most clicks.
Useful filters and combinations
- Exclude your brand. Add a query filter “Queries not containing” your brand name. Brand searches usually perform well regardless of SEO; non-brand searches show how you are doing on topics.
- One page at a time. Click a page in the Pages tab, then open the Queries tab to see which searches that page appears for. This tells you whether the page is understood the way you intended.
- Question queries. Filter queries containing words such as “how”, “what”, “why” or “cost” to find questions worth answering in guides or FAQs.
- Device split. Compare mobile and desktop. A big difference in CTR or position can point to mobile usability or layout problems.
- Country filter. For local businesses, focus on your own country. For international sites, check that each language version gets visibility where you expect.
- Regular expressions. The query and page filters accept regular expressions, which let you group many variations at once, such as all queries mentioning several service names.
The less obvious tabs
Most people only use Queries and Pages, but the other tabs answer specific questions:
- Search appearance shows clicks and impressions for special result types your pages earned, such as rich results for products, review snippets, videos or FAQ results. If you added structured data, this is where you see whether it produced any visible enhancement.
- Dates lists daily figures in a table, which is handy for spotting the exact day a change started and matching it with your change log or a known Google update.
- Countries reveals demand you may not have noticed, for example steady impressions from a neighbouring country where you could deliver.
- Devices shows the share of mobile, desktop and tablet searches, which helps decide where to focus design and speed work.
There is also a separate Discover report for sites whose content appears in Google Discover feeds on phones. Most small business sites will see little or nothing there, which is normal.
Reading a traffic drop
When clicks fall, work through the possibilities calmly before changing anything:
- Check the date range. Compare equal periods and account for seasonality, holidays and weekends.
- Clicks or impressions? If impressions fell too, you are being shown less, which points to rankings, indexing or demand. If impressions held but clicks fell, the results page may have changed, with more ads or answer features, or your snippet became less attractive.
- Which pages? Find the pages that lost the most clicks. A drop concentrated on a few pages suggests page-level issues; a drop across the whole site suggests something site-wide.
- Which queries? Did you lose positions, or did people search less for the topic? Google Trends can indicate whether overall interest changed.
- Technical checks. Look at the Page indexing report for new errors, check for accidental noindex or robots.txt changes, and inspect affected URLs.
- Recent changes. Redesigns, plugin updates, URL changes and content edits often coincide with drops. Keep a change log to make this easy.
Limits of the data
Search Console data is very useful but not complete:
- Some rare queries are hidden to protect user privacy, so query totals are lower than page totals.
- The data is usually delayed by a couple of days.
- Only 16 months of history are kept, so export data regularly if you want long-term records.
- The table shows a limited number of rows in the interface; exports or the API give more.
- Numbers are about Google Search only, not other search engines or AI assistants.
A monthly routine
- Compare the last 28 days with the previous 28 days, and with the same period last year.
- Note the top five gaining and top five losing pages.
- Review non-brand queries in positions 5 to 20 and pick one or two pages to improve.
- Look for high-impression, low-CTR pages and rewrite their titles or descriptions.
- Scan new queries for topics your site does not yet cover well.
- Write down what you changed, so next month’s comparison tells you whether it worked.
How Site AI Audit complements the report
The Performance report shows results; it does not explain technical causes. Site AI Audit checks the causes directly, such as missing or duplicate titles, weak descriptions, broken links, redirects, noindex rules, speed and SSL, and explains each finding in plain words. When a page underperforms in Search Console, an audit is a quick way to rule technical issues in or out. Run a free check, or see the plans for re-checks after each change.
Related reading
- How to Set Up Google Search Console for a Small Business
- How to Write Title Tags: A Practical Guide for Small Sites
- Meta Descriptions: What They Do and How to Write Them
- Keyword Research for Small Businesses: A Simple Method
The bottom line
The Performance report tells you what people search for, where you appear and how often they choose you. Read it one page or query at a time, compare equal periods, exclude brand searches when judging SEO, and focus on pages close to the top and listings with low click-through rates. Treat site-wide average position with caution, and keep a log of changes so the numbers can tell you what worked.
SSS
What is a good CTR in Search Console?
It depends heavily on position, query type and the layout of the results page. Compare your pages with each other at similar positions rather than with a fixed benchmark.
Why do query totals not match page totals?
Google hides some rare queries for privacy reasons. Those clicks and impressions count in page and site totals but do not appear as individual queries.
Why did impressions go up but clicks stay the same?
You are probably appearing for more searches at lower positions, where few people click. It is often an early sign of growing visibility.
How far back does Search Console data go?
Sixteen months. Export the data regularly or connect it to a reporting tool if you need a longer history.
Does the Performance report include Bing traffic?
No, it covers Google Search only. Use Bing Webmaster Tools for Bing data and your analytics tool for traffic from all sources.