ENEnglish
 LTLietuviškai
 DEDeutsch
 FRFrançais
 RUРусский
 ESEspañol
 PLPolski
 ITItaliano
 UKУкраїнська
 CSČeština
 PTPortuguês
 JA日本語
JA日本語 LVLatviešu valoda
 ETEesti
 HUMagyar
 IDBahasa Indonesia
 TRTürkçe
 HIहिन्दी
 ELΕλληνικά
 ARالعربية
 THไทย
THไทย VITiếng Việt
 RORomână
 MSBahasa Melayu
 BNবাংলা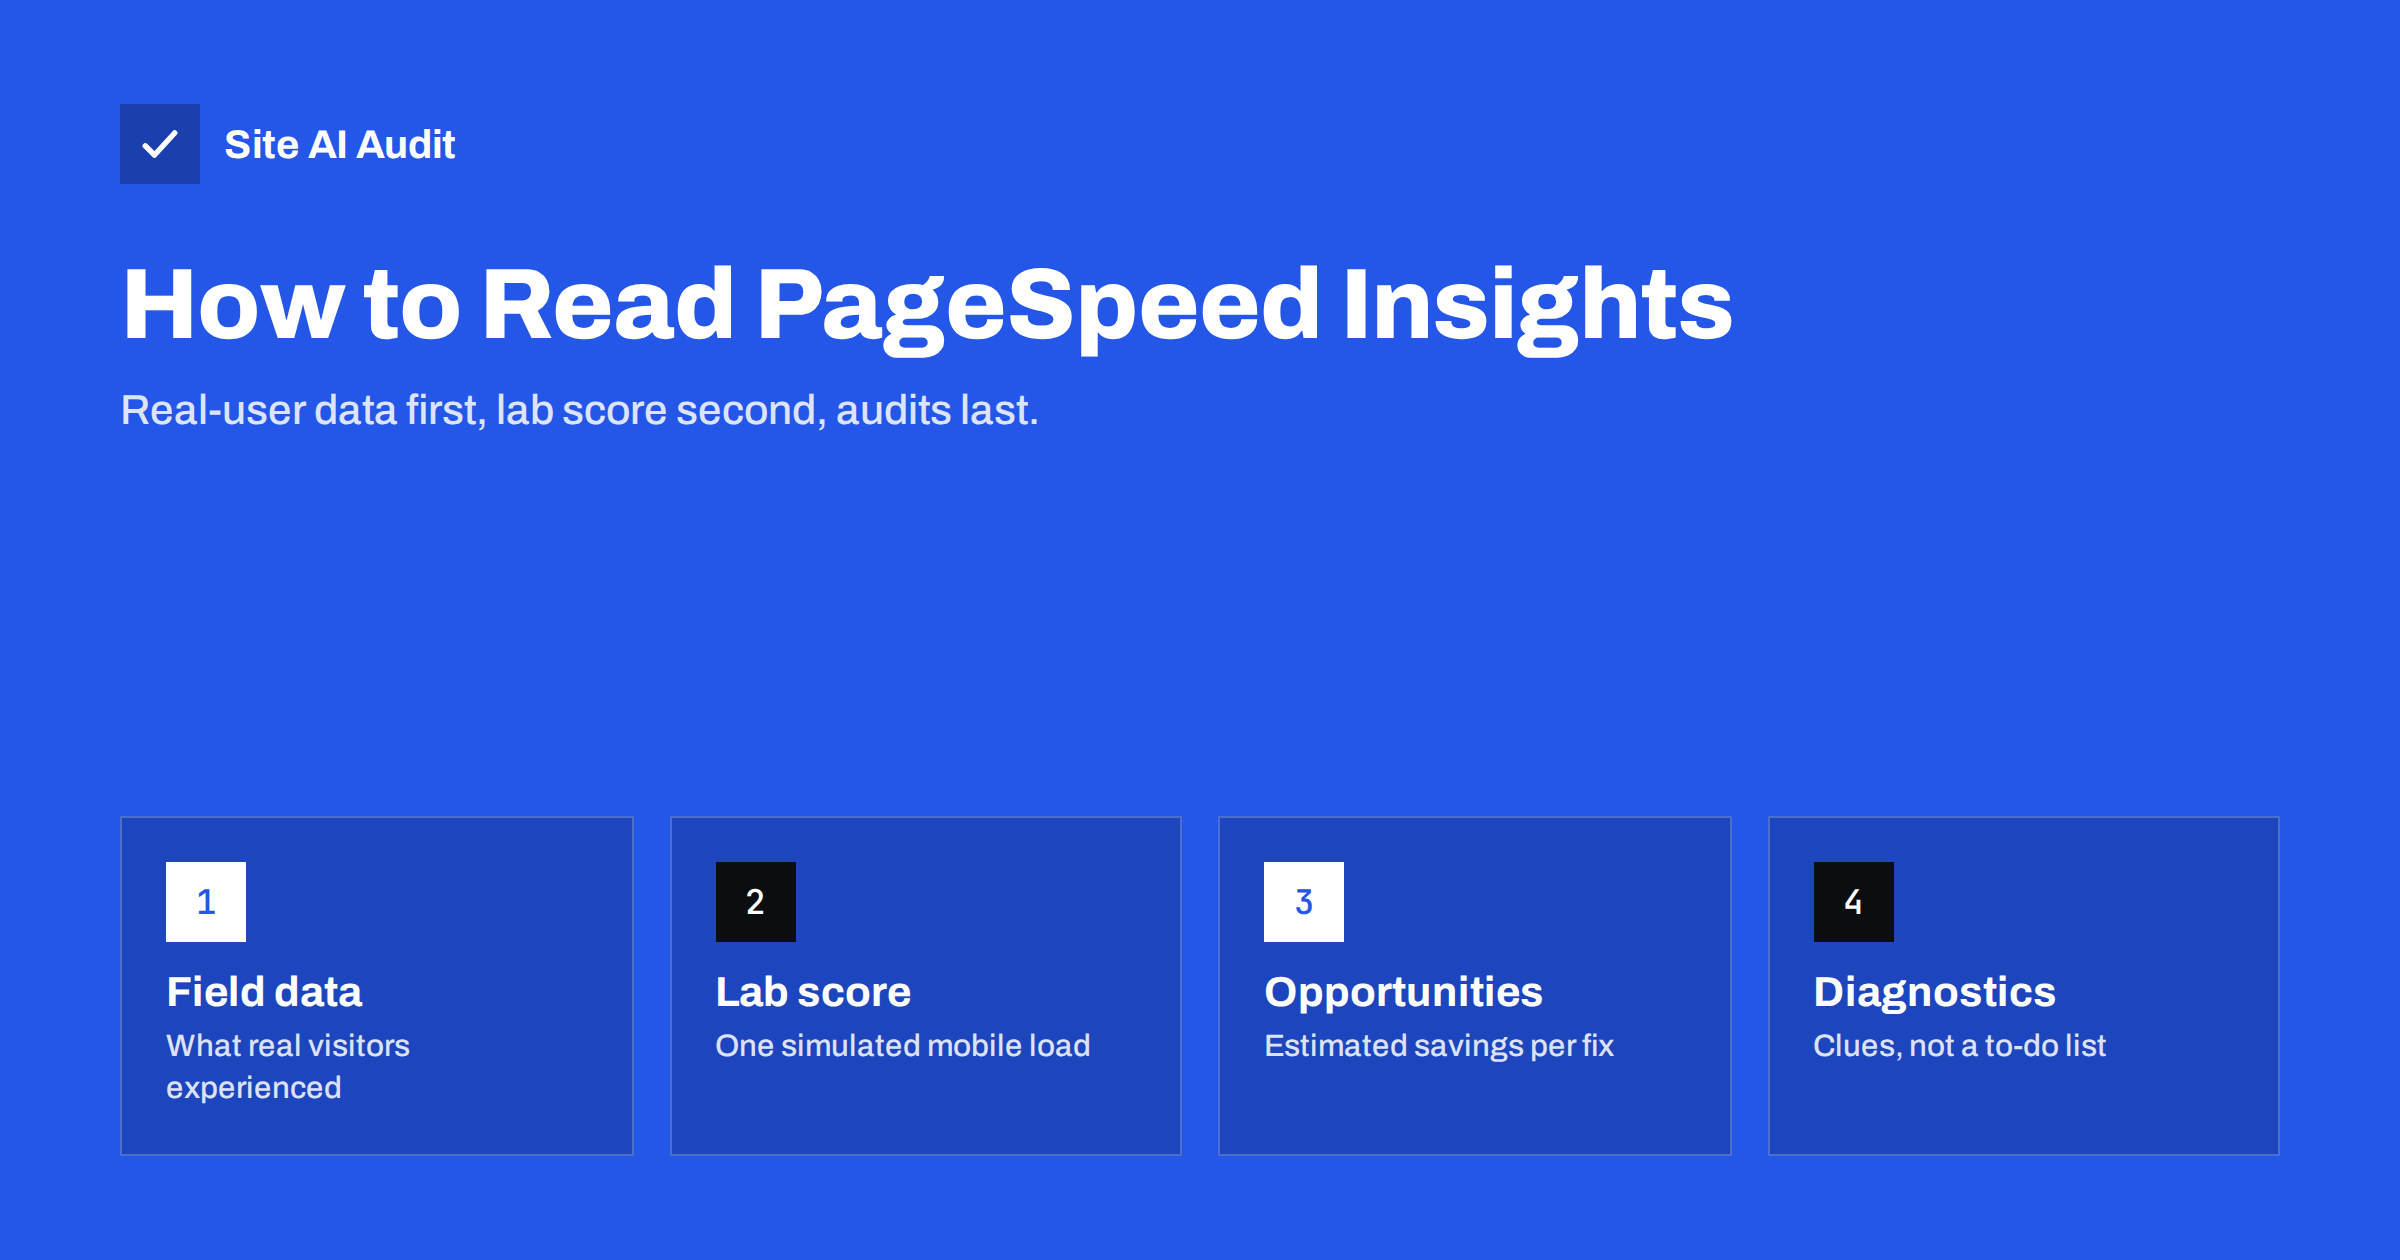
Short answer: A PageSpeed Insights report has two layers. The top section shows field data from real Chrome users over the last 28 days, including the Core Web Vitals assessment that matters for Google. The lower section is a Lighthouse lab test with a 0–100 performance score, metric values and a list of opportunities and diagnostics. Read the field data to know where you stand, then use the lab audits, starting with the largest estimated savings, to decide what to fix.
PageSpeed Insights is the first speed tool most website owners meet, and it can be confusing. It shows a big coloured score, a “passed” or “failed” assessment that may contradict it, and dozens of technical recommendations. Business owners often try to reach 100 and spend days on changes that make no difference to visitors. This guide walks through the report from top to bottom and explains which parts deserve your attention.
Mobile and desktop tabs
Every report has two tabs: mobile and desktop. The mobile test simulates a mid-range phone on a slower network, so its results are almost always worse. Start with mobile. Most small-business websites receive the majority of their visits from phones, and Google’s assessment of your site is heavily influenced by mobile experience.
Do not be surprised if desktop shows 95 and mobile shows 45. That is normal for many sites and simply reflects how much slower phones are at downloading and running the same page.
Section 1: “Discover what your real users are experiencing”
The top of the report shows field data from the Chrome User Experience Report (CrUX). This is data from real visits by Chrome users who have opted in to sharing usage statistics, collected over the previous 28 days.
- Core Web Vitals Assessment: “Passed” or “Failed”. To pass, the page (or origin) needs good values for LCP, CLS and INP at the 75th percentile.
- Metric bars: each metric shows the share of visits in the good, needs-improvement and poor ranges, plus the 75th percentile value.
- Other metrics: First Contentful Paint (FCP) and Time to First Byte (TTFB) are shown for diagnostic purposes but are not part of the assessment.
- This URL vs Origin: you can switch between data for the specific page and data for your whole domain.
If the page does not have enough traffic, the report says there is no data for this URL and may fall back to origin data. Very small sites often have no field data at all. In that case, skip to the lab section, but remember that it is a simulation.
Section 2: the performance score
Below the field data is the Lighthouse diagnosis, starting with the performance score from 0 to 100. It is calculated from several lab metrics, each with a weight. In current Lighthouse versions, Total Blocking Time, Largest Contentful Paint and Cumulative Layout Shift carry the most weight, with First Contentful Paint and Speed Index contributing less.
Important things to understand about this score:
- It is not used directly by Google Search. Search uses field data, not the lab score.
- It varies between runs. Network conditions, server load and third-party scripts cause a few points of difference from test to test.
- It is harsh on mobile. The simulated device and network are deliberately slow to represent many real users.
- It is a summary. Two sites with the same score can have completely different problems.
The score is useful for tracking your own progress over time. It is not useful for comparing yourself with competitors or for deciding that a site is “good” or “bad” on its own.
Section 3: the lab metrics
Under the score, the report lists the individual lab metrics with coloured indicators:
| Metric | What it tells you |
|---|---|
| First Contentful Paint | When the first text or image appeared |
| Largest Contentful Paint | When the main content appeared |
| Total Blocking Time | How long the main thread was blocked by long tasks during load |
| Cumulative Layout Shift | How much the layout moved during load |
| Speed Index | How quickly the visible area filled in |
Total Blocking Time is the lab stand-in for Interaction to Next Paint, which cannot be measured without a real user. If TBT is high, expect INP problems in the field. If FCP is fine but LCP is slow, look at the main image or render-blocking resources. If everything is slow, start with server response time.
The filmstrip of screenshots below the metrics shows how the page appears during loading. It is a quick way to see what visitors look at while they wait.
Section 4: Opportunities and diagnostics
This is the part that generates the longest to-do lists. Recent versions of the report group audits as “Insights” and “Diagnostics”, and many show an estimated saving in seconds or kilobytes.
Common items and what they usually mean:
- Improve image delivery / properly size images / modern formats: images are larger than needed. Often the fastest win.
- Render-blocking requests: CSS or JavaScript files delay the first render. Defer scripts and reduce CSS.
- Reduce unused JavaScript or CSS: files contain a lot of code not used on this page, typical of themes, builders and plugins.
- Document request latency / server response time: the HTML took long to arrive. Check caching and hosting.
- LCP breakdown and LCP request discovery: which phase of LCP is slow, and whether the main image was found early and not lazy-loaded.
- Layout shift culprits: which elements moved and why.
- Third parties: how much time external scripts took on the main thread.
- Avoid an excessive DOM size: the page has very many elements, which slows rendering and interactions.
Estimated savings are approximate, but they are a reasonable way to prioritise. A recommendation that saves 2 seconds deserves attention before ten that save 50 milliseconds each.
What you can safely ignore
Not every recommendation is worth acting on:
- Small savings on third-party scripts you cannot control, such as a payment provider’s library that must be present at checkout.
- “Serve static assets with an efficient cache policy” for external files hosted by others; you cannot change their headers.
- Chasing 100. Moving from 90 to 100 on mobile often costs a lot of effort for no visible difference to visitors.
- Passed audits. The report lists them for completeness; they need no action.
Turning the report into a fix list
- Note whether the Core Web Vitals assessment passes on mobile and which metric fails.
- Match the failing metric to its likely causes: LCP to server, images and render-blocking; CLS to dimensions and injected content; INP to JavaScript.
- Pick the two or three audits with the largest estimated savings related to that metric.
- Fix one at a time, testing again after each change, and run the test several times to smooth out variation.
- Test other page types too: home, a typical article, a product and a contact page often have different problems.
Keep a simple record of each test: date, page, mobile score, the three lab metrics that matter most and what you changed. After a few weeks, compare it with the field data at the top of the report. This record is also valuable when you work with a developer or agency, because it shows which changes actually moved the numbers and prevents the same experiment from being repeated.
How Site AI Audit helps
Site AI Audit runs Google PageSpeed for mobile as one step of a wider check that also crawls up to 50 pages, tests SSL and security headers and looks at SPF, DKIM and DMARC. Instead of a long list of technical audits, each finding is written in plain words with what is wrong, why it matters and how to fix it, ranked by impact across all areas. You can check your site for free and compare it with your own PageSpeed report.
Related reading
- Core Web Vitals Explained for Small Business Websites
- How to Improve Largest Contentful Paint (LCP) on Any Website
- Interaction to Next Paint (INP): How to Fix Slow Interactions
The bottom line
Read a PageSpeed Insights report from the top. Field data tells you how real visitors experience the page and whether you pass Core Web Vitals. The lab score is a noisy summary that helps you track progress. The audits are clues; pick the few with the largest savings for the metric that fails, fix them one by one and test again.
SSS
Why is my PageSpeed score different every time I test?
Lab tests depend on network conditions, server load and third-party scripts at that moment, so scores vary by several points between runs. Run the test three to five times and look at the typical result. Large swings usually point to an unstable server or heavy third-party content.
Does Google use the PageSpeed score for rankings?
No. Google Search uses Core Web Vitals field data from real users, not the Lighthouse lab score. The lab score is a diagnostic tool for developers and site owners. Improving the underlying metrics is what matters.
Why does my site pass Core Web Vitals but have a low score?
The assessment uses real users, who may have faster devices and connections than the simulated mobile test. The lab score also weighs Total Blocking Time heavily. Passing field data is the more important result, but a low lab score can still reveal problems for slower visitors.
What does “no data” mean in PageSpeed Insights?
It means there were not enough Chrome visits to that page or origin in the last 28 days to publish field statistics. This is common for small sites and new pages. Use the lab data as your guide in that case.
Should I aim for a score of 100?
Not necessarily. A score in the green range with passing Core Web Vitals is a good result for most business sites. Chasing the last few points often requires removing useful features for no noticeable benefit to visitors.