ENEnglish
 LTLietuviškai
 DEDeutsch
 FRFrançais
 RUРусский
 ESEspañol
 PLPolski
 ITItaliano
 UKУкраїнська
 CSČeština
 PTPortuguês
 JA日本語
JA日本語 LVLatviešu valoda
 ETEesti
 HUMagyar
 IDBahasa Indonesia
 TRTürkçe
 HIहिन्दी
 ELΕλληνικά
 ARالعربية
 THไทย
THไทย VITiếng Việt
 RORomână
 MSBahasa Melayu
 BNবাংলা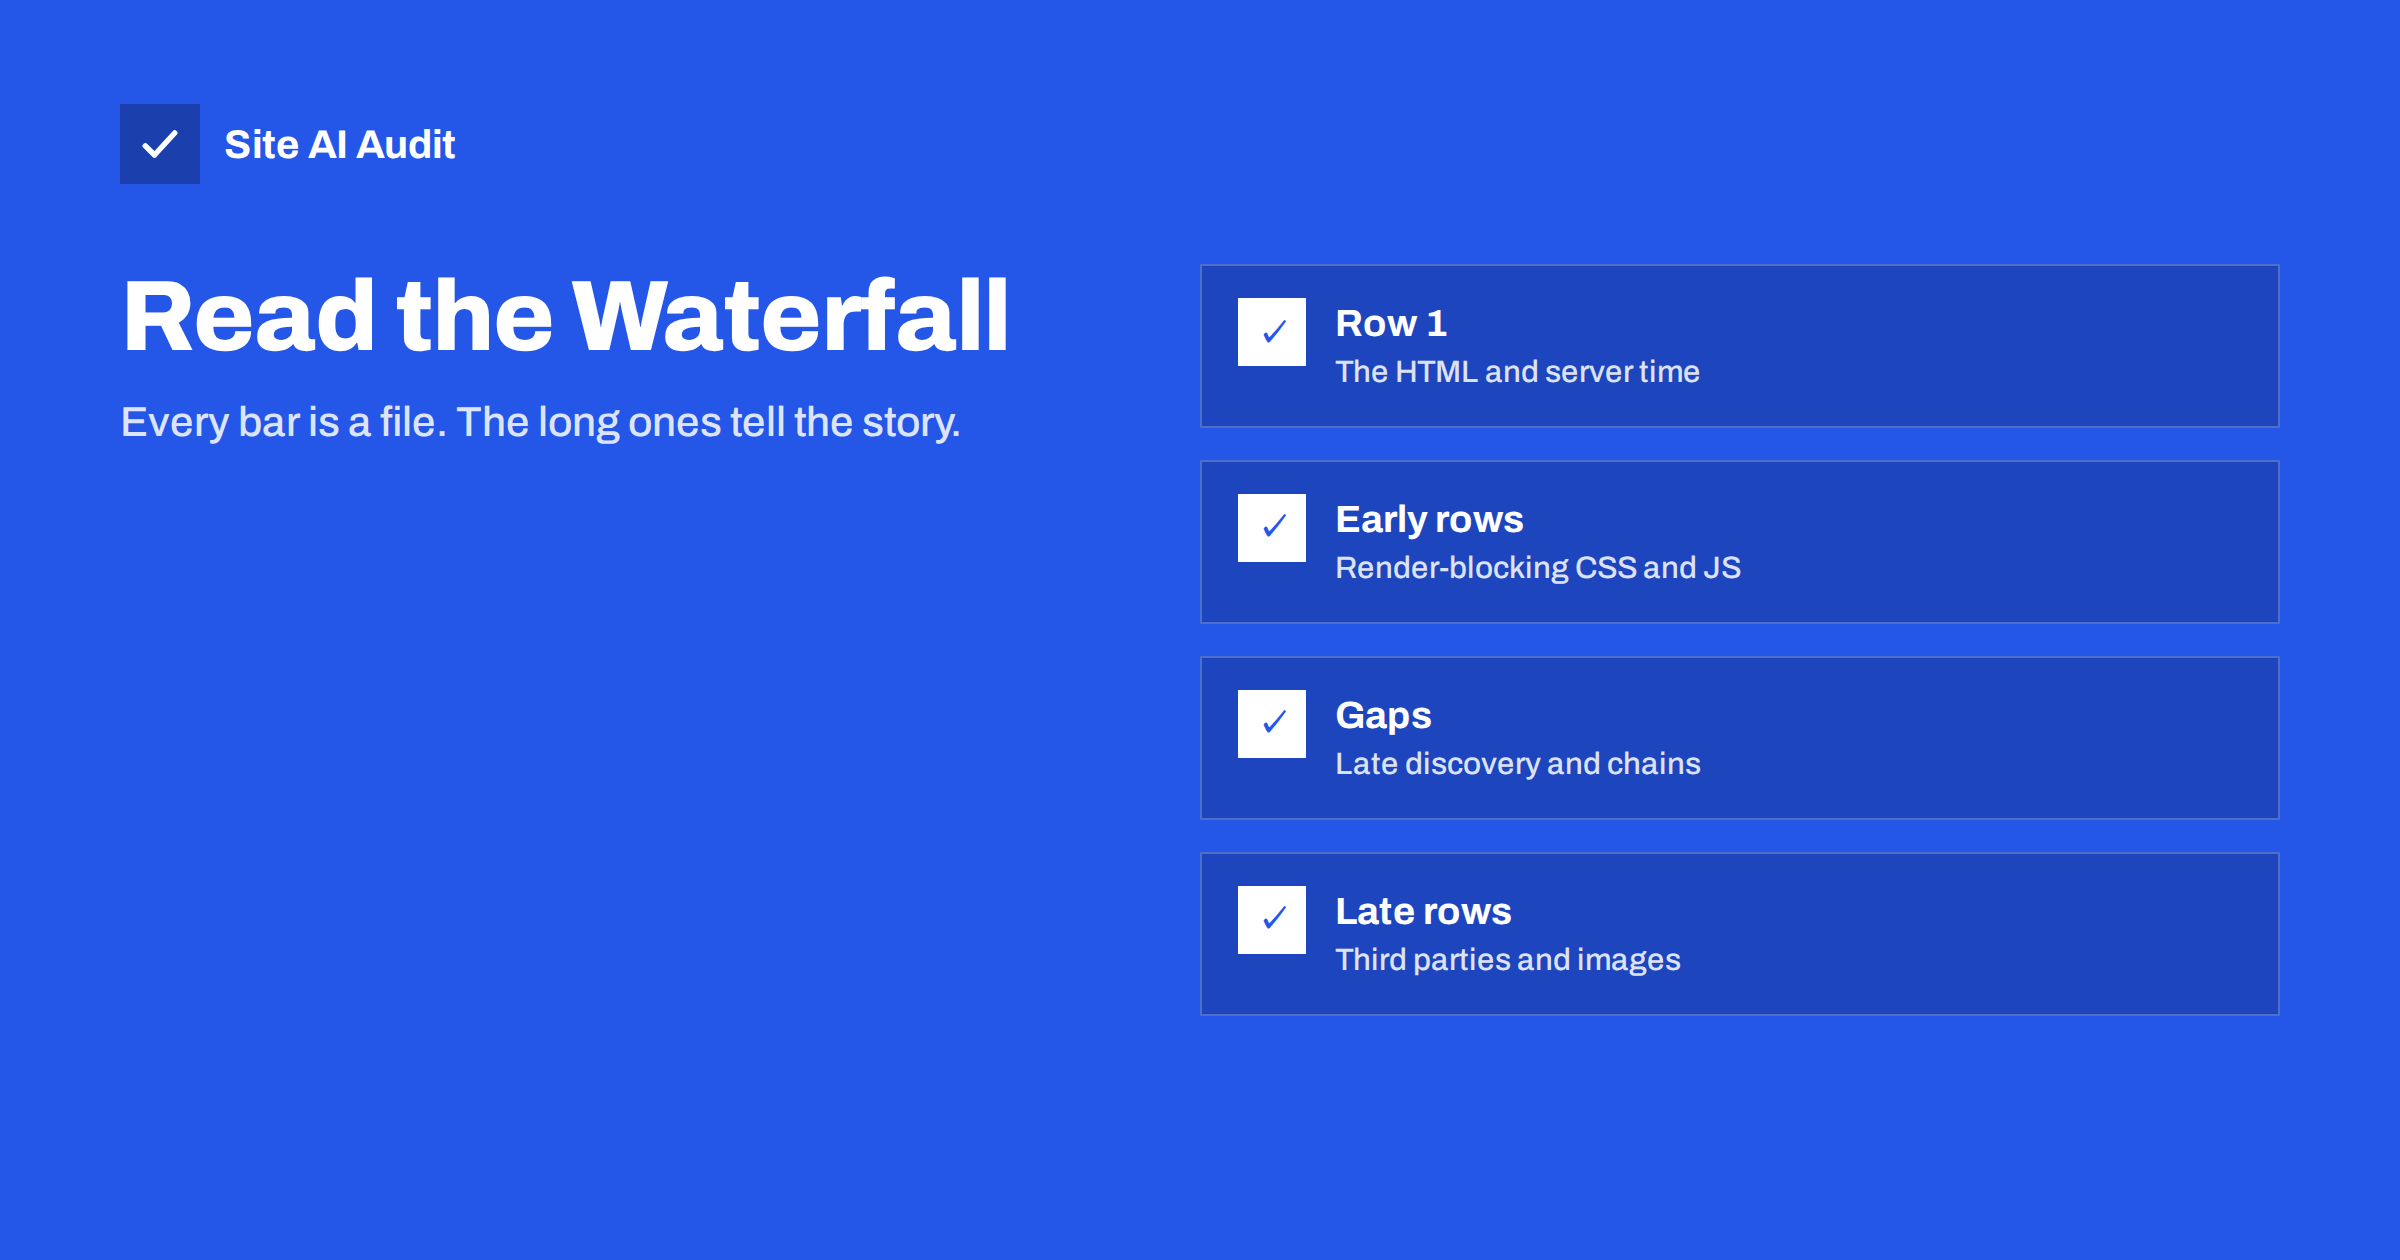
Short answer: A waterfall chart lists every request a page makes, one row per file, with a horizontal bar showing when it started and how long each phase took: DNS lookup, connection, TLS, waiting for the server and downloading. Read it from top to bottom. A long wait on the first row means a slow server. Stylesheets and scripts that start early and finish just before the first paint are render-blocking. Gaps and staircases show files discovered late or loaded in chains. Long bars from other domains point to third-party scripts. Fix the requests that sit on the path to the first paint and the largest element.
Where to find a waterfall chart
Several tools draw waterfalls:
- Browser developer tools. In Chrome, Edge or Firefox, open the developer tools, go to the Network panel and reload the page. Use the throttling options to simulate a slower connection, and disable the cache to see a first visit.
- Online testing services such as WebPageTest and GTmetrix draw detailed waterfalls from real browsers in different locations, with markers for key moments such as start render and Largest Contentful Paint.
- Lighthouse and PageSpeed Insights do not show a full waterfall, but their diagnostics, such as render-blocking resources and the network dependency tree, come from the same data.
Our comparison of speed testing tools explains which tool suits which question. For learning to read waterfalls, the browser’s Network panel is the easiest place to start because you can repeat tests instantly.
The anatomy of a row
Each row is one request: the URL, the type of file, the status code, the size and a bar on a timeline. The bar is split into coloured phases. Colours differ between tools, but the phases are the same:
- Queueing or stalled. The browser has found the file but is not yet requesting it, often because of priorities or connection limits.
- DNS lookup. Finding the IP address for a domain. It appears only on the first request to each domain.
- Initial connection. Opening the TCP connection, or the QUIC connection with HTTP/3.
- TLS or SSL. The encryption handshake.
- Waiting, also called Time to First Byte. The time between sending the request and receiving the first byte of the response. For dynamic HTML this is mainly server processing time.
- Content download. Receiving the rest of the file. Long download phases mean large files or slow connections.
Vertical lines across the chart mark events such as the first paint, DOMContentLoaded, Largest Contentful Paint and the load event. Everything to the left of the first paint line delays the moment the visitor sees anything.
Reading the first row: the HTML document
The first row is almost always the page itself. It sets the pace for everything else, because the browser cannot discover other files until the HTML starts arriving.
- Redirect rows before it. If the first rows are 301 or 302 responses, for example from HTTP to HTTPS and then to www, each costs a full round trip. Link directly to the final URL; our guide to redirect chains explains how to find and remove them.
- A long waiting phase. If the green or purple waiting segment is several hundred milliseconds or more, the server is slow to build the page. Caching, faster hosting or lighter code fix this; see how to reduce TTFB.
- Long connection and TLS phases. These depend on distance and network. A CDN or a server closer to your visitors shortens them.
Spotting render-blocking files
Right after the HTML, the browser requests the files referenced in the page head. Stylesheets and synchronous scripts block rendering: the browser will not paint until they are downloaded and processed. In the waterfall they appear as early rows whose bars end just before the first paint line. Many tools mark them with a special icon or colour.
Look for:
- Several separate CSS files from plugins, each a blocking request.
- Scripts in the head without
deferorasync. - Stylesheets loaded from other domains, such as font services, which add their own DNS, connection and TLS phases.
The fixes are to combine or remove unnecessary CSS, defer scripts that are not needed for the first view and inline the small amount of critical CSS. Our guide to eliminating render-blocking resources covers each technique.
Gaps, staircases and late discovery
A healthy waterfall starts many requests early, in parallel. Two patterns show that the browser discovered files too late:
Staircases. One file finishes, then the next starts, then the next. This is a dependency chain: a CSS file imports another CSS file, which loads a font; or a script loads another script, which loads a third. Each step waits for the previous one. Break chains by referencing important files directly in the HTML, or by using preload for files the browser cannot see early.
Gaps. A period where little happens, followed by a burst of requests. This often means the browser was busy running JavaScript, or that content such as the main image was only inserted by a script. If your Largest Contentful Paint element is an image that starts downloading late in the waterfall, make it visible in the HTML, avoid lazy loading it and consider fetchpriority="high". Our guide to improving LCP goes deeper.
Third parties, heavy files and the long tail
Group the rows by domain. Most tools let you sort or colour by domain. Requests from analytics, advertising, chat widgets, video players, maps and social embeds often make up a large share of the waterfall. Ask for each one whether it is needed, whether it must load before the page is usable and whether it can be delayed until interaction.
Then sort by size. The heaviest files are usually images, videos, fonts and large JavaScript bundles. A single uncompressed hero image of several megabytes shows up as a very long download phase. Check also whether text files are compressed: the size column often shows both the transferred and the actual size, and a transferred size equal to the full size for CSS or JavaScript means compression is off.
Finally, look at status codes. Rows with 404 errors are wasted requests for missing files. Repeated 301 responses for assets mean outdated URLs in your templates.
First view versus repeat view
Compare the waterfall of a first visit with that of a second visit. On the repeat view, static files such as stylesheets, scripts, fonts and logos should come from the browser cache, shown in most tools as “memory cache” or “disk cache”, or as very short rows with a 304 status. If they are downloaded in full again, your caching headers are missing or too short, and every page view costs returning visitors the same as the first one. Our guide to browser caching shows how to set them. The HTML itself is usually revalidated or fetched again, which is normal.
A simple routine for any slow page
- Test the page with cache disabled and a mobile network profile.
- Check the first row: redirects and server waiting time.
- Find the first paint and LCP markers and list every request that ends before them.
- Remove or defer the render-blocking requests you do not need.
- Find the LCP resource and make sure it starts early.
- Sort by domain and size, and deal with the heaviest third parties and files.
- Retest and compare the waterfalls side by side.
Test more than once. Network conditions vary, and a single run can mislead. Our article on why speed scores change between tests explains the variation.
How Site AI Audit helps
Site AI Audit summarises what a waterfall would show you on the key points: Google PageSpeed results for mobile with LCP, CLS and INP, how long your server takes to respond, whether text files are compressed, how heavy the home page is, whether the server still uses HTTP/1.1 and which pages took more than two seconds to load during the crawl. Each finding comes with a plain-language fix, ranked by impact, so you know which part of the waterfall to look at first. You can run a free check, and the pricing page lists plans with unlimited re-checks.
Related reading
- How to Read a PageSpeed Insights Report Without Guesswork
- How Third-Party Scripts Slow Down Your Website (and Fixes)
- Too Many HTTP Requests? When It Still Matters for Speed
- 103 Early Hints: Start Loading Before the HTML Arrives
The bottom line
A waterfall chart turns “the page is slow” into a list of specific requests and delays. Start with the HTML row and its server time, then the render-blocking files before the first paint, then late-discovered files and chains, and finally third parties and heavy files. Fix what lies on the path to the first paint and the largest element, retest, and compare. After a few pages, you will read a waterfall at a glance.
FAQ
What does a long green bar on the first row mean?
In most tools that colour marks waiting time, the time the server takes to start answering. A long bar on the HTML document means the server builds the page slowly.
Why do some requests wait before starting?
The browser may queue requests because of priorities, connection limits or because it is busy running JavaScript. Long queueing on important files suggests they are discovered or prioritised too late.
Should I test with the cache disabled?
Yes, to see what a first-time visitor experiences. Test with the cache enabled as well to check that repeat visits use cached files.
Which requests should I fix first?
Those that finish before the first paint and the request for the largest visible element. They decide when visitors see the page.
Do fewer requests always mean a faster page?
Not always. With HTTP/2 and HTTP/3 many small requests are fine. What matters more is how early critical files start and how large they are.