ENEnglish
 LTLietuviškai
 DEDeutsch
 FRFrançais
 RUРусский
 ESEspañol
 PLPolski
 ITItaliano
 UKУкраїнська
 CSČeština
 PTPortuguês
 JA日本語
JA日本語 LVLatviešu valoda
 ETEesti
 HUMagyar
 IDBahasa Indonesia
 TRTürkçe
 HIहिन्दी
 ELΕλληνικά
 ARالعربية
 THไทย
THไทย VITiếng Việt
 RORomână
 MSBahasa Melayu
 BNবাংলা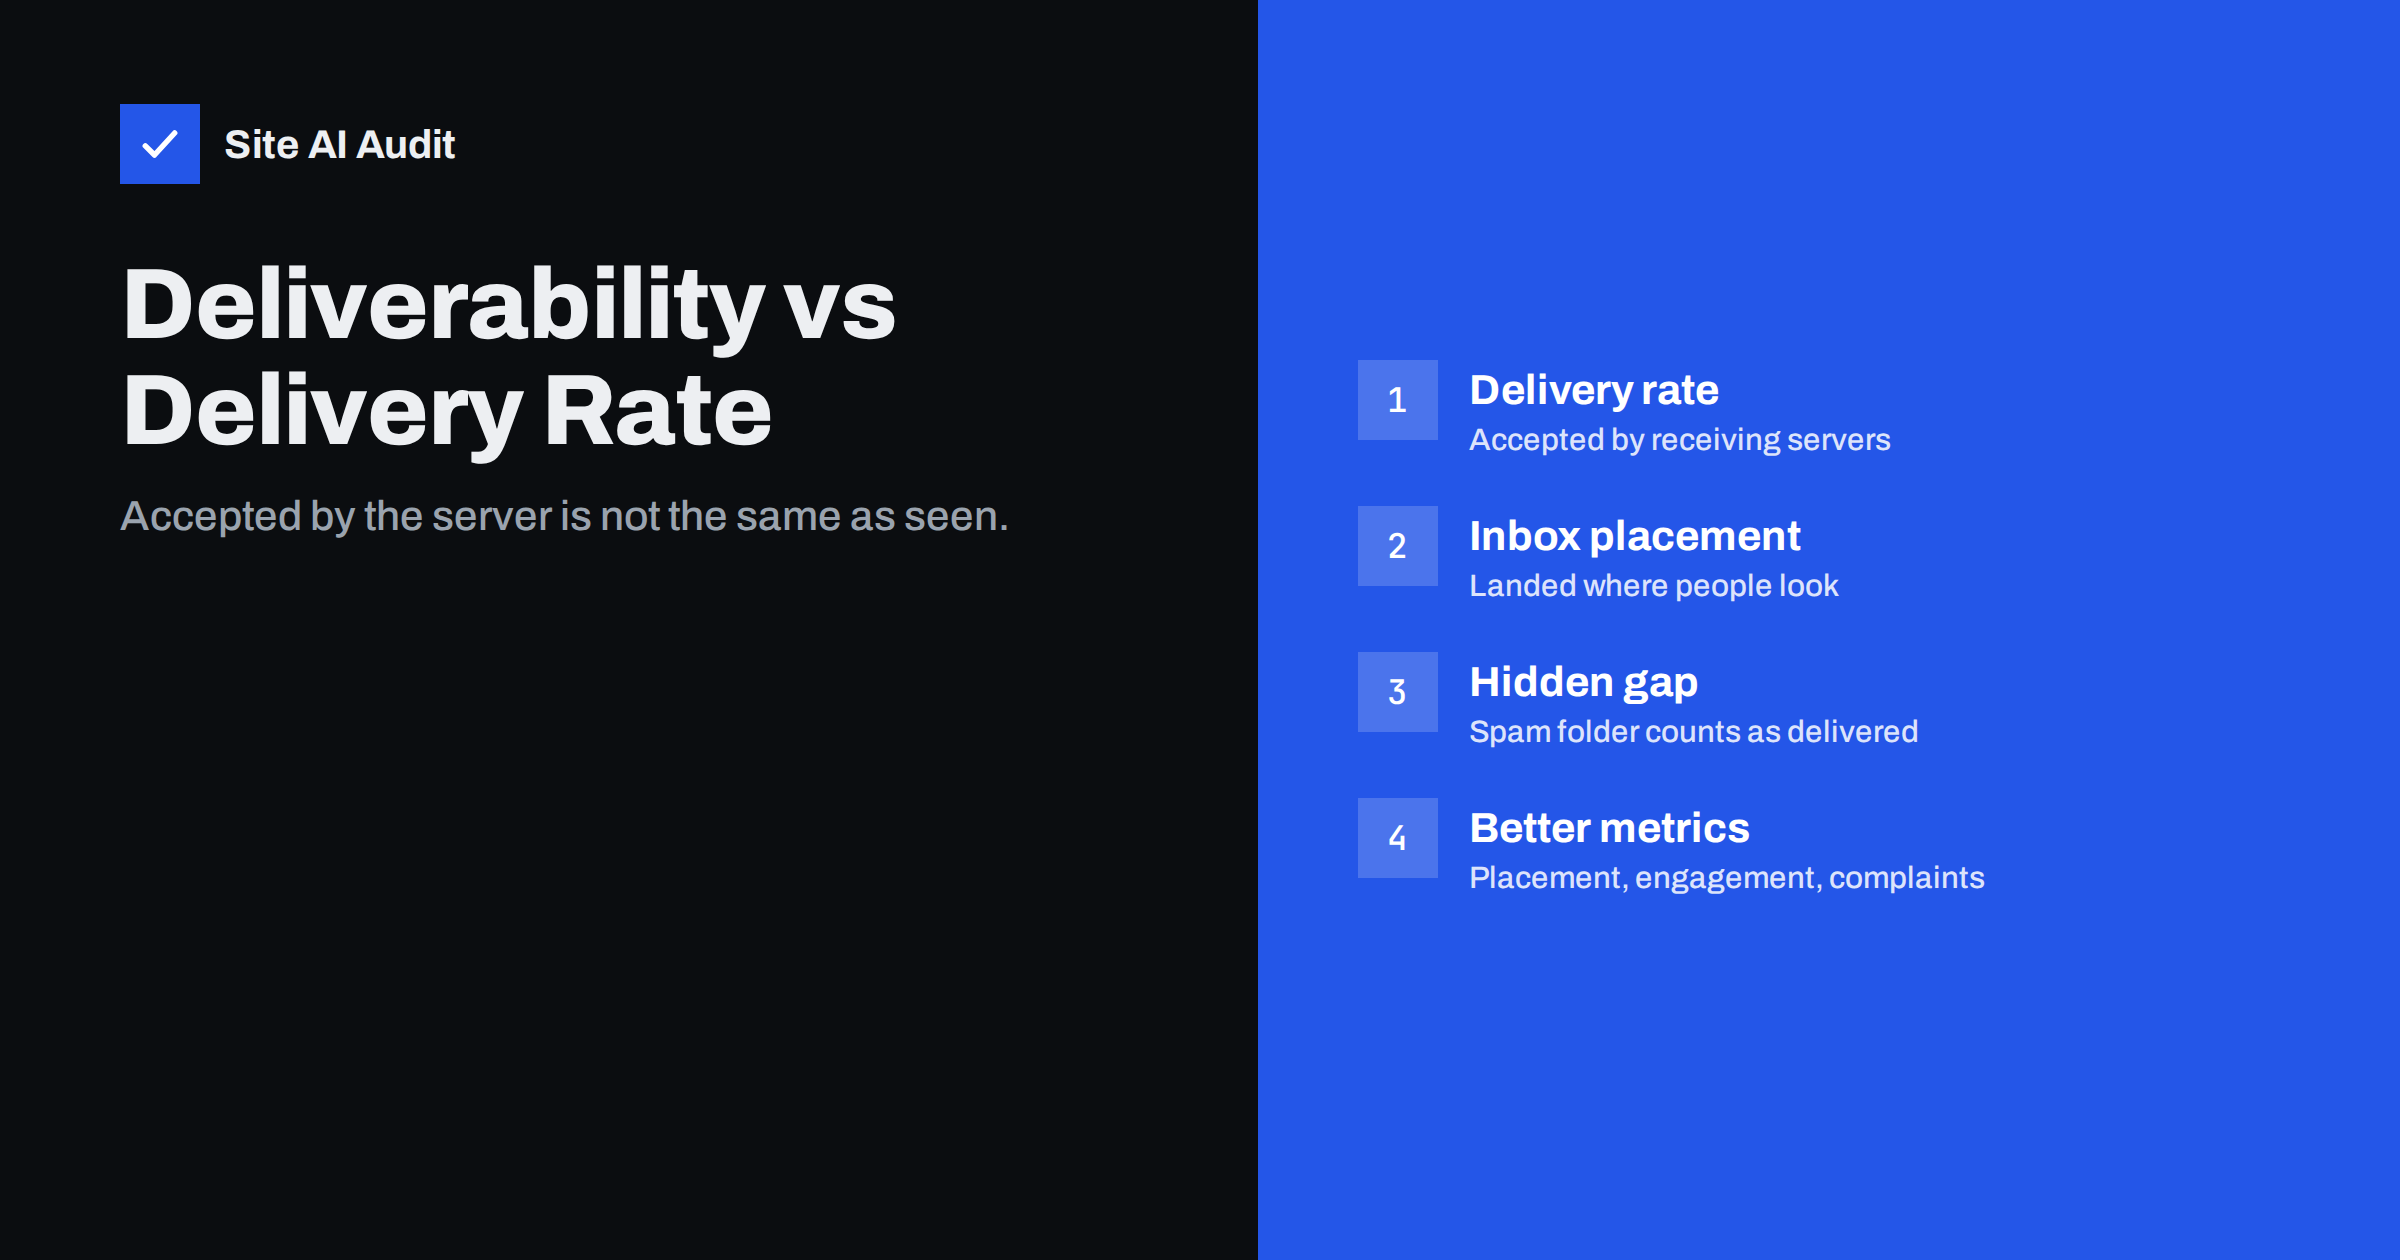
Short answer: Delivery rate is the share of sent messages that receiving servers accepted, meaning they did not bounce. Deliverability, or inbox placement, is whether accepted messages reached the inbox rather than the spam or junk folder. A message in spam counts as delivered, so a campaign can show a 99% delivery rate while a large share of it is never seen. Watch bounces for delivery, and inbox placement tests, engagement, complaint rates and authentication results for deliverability.
Two different questions
Every e-mail passes two gates. The first is the receiving server: will it accept the message at all? If not, the message bounces, and your sending platform counts it as not delivered. The second gate is the filter behind the server: once accepted, where does the message go? Inbox, promotions tab, spam folder, or a quarantine the recipient never checks?
Delivery rate measures the first gate. Deliverability is about the second. Most dashboards show the first number prominently, because it is easy to measure: the receiving server answers with a clear code. The second is much harder to see, because mailbox providers do not tell senders which folder a message went to.
There is also a third outcome between the two: deferral. A receiving server can temporarily refuse mail, asking the sender to try again later. Deferred messages are usually delivered eventually, but a pattern of deferrals is often the first sign that a provider has started to distrust you, and it shows up as delays rather than bounces.
This gap causes a lot of false comfort. Teams look at “Delivered: 99.2%” and conclude that e-mail is working, while customers never see the messages.
What the delivery rate tells you
The delivery rate is calculated as delivered messages divided by sent messages. Messages that are not delivered are bounces, either hard (permanent) or soft (temporary failures that eventually gave up). A falling delivery rate usually points to:
- List quality problems: old, mistyped or invalid addresses causing hard bounces.
- Blocking: a receiver rejecting your mail outright because of a blocklist, reputation or policy.
- Authentication failures under enforced DMARC: a receiver rejecting mail that fails your own
p=rejectpolicy. - Technical errors: misconfigured sending servers, missing reverse DNS or rate limits.
Pay attention to how your platform counts. Some tools report “delivered” as soon as their own server hands the message over, others only after the receiving server confirms acceptance. Some remove previously bounced addresses from the “sent” number before calculating the rate, which makes it look better. Compare like with like when you switch platforms or compare campaigns.
A high delivery rate is necessary but not sufficient. It shows the list is mostly valid and you are not being blocked wholesale. It says nothing about placement.
What deliverability means in practice
Deliverability is the combined result of how mailbox providers judge you and your message. The main inputs are:
- Authentication: SPF, DKIM and DMARC passing and aligned with your From domain.
- Reputation: the history of your domain and IP, built from complaints, engagement, bounces and spam trap hits.
- Recipient engagement: opens, replies, moving messages out of spam, deleting without reading.
- Content and format: honest subject lines, working links to reputable domains, sensible HTML.
- Sending patterns: consistent volume, gradual increases, no sudden bursts from new domains.
Gmail’s tabs add a nuance. A newsletter in the Promotions tab is in the inbox from a filtering point of view; it is not spam. Promotions placement reflects the type of content, and fighting it with tricks tends to backfire.
Corporate recipients add another layer. Many companies run their own security gateways, which may quarantine messages before they reach the mailbox at all. The recipient’s mail provider accepted the message, your platform counts it as delivered, and yet nobody in that company sees it until an administrator releases it.
The two metrics compared
| Delivery rate | Deliverability (inbox placement) | |
|---|---|---|
| Question | Did the receiving server accept it? | Did it reach the inbox? |
| Measured by | Bounce data from the sending platform | Seed tests, provider tools, engagement trends |
| Main causes of problems | Invalid addresses, blocks, rejections | Authentication, reputation, engagement, content |
| Visibility | Precise, per message | Indirect, estimated |
| A good number looks like | Very few bounces | Stable engagement, low complaints, clean authentication |
A worked example
Imagine a shop that sends a weekly newsletter to 20,000 subscribers. The platform reports 19,850 delivered, a delivery rate of about 99%. The team is satisfied. Yet sales from e-mail have been falling for two months.
A closer look tells a different story. Click rates for Gmail recipients dropped by more than half over the same period, while clicks from other providers stayed stable. Postmaster Tools shows the spam rate crossing 0.3% after a campaign to an old segment of contacts who had not heard from the shop in over a year. The headers of a test message reveal that the newsletter platform still signs with its own domain rather than the shop’s, so DMARC fails alignment.
In other words, the messages were delivered, but a large part of the Gmail audience was receiving them in spam. The fix had nothing to do with bounce handling: the shop set up custom domain DKIM, stopped mailing the old segment, sent only to engaged subscribers for a few weeks, and watched the Gmail click rate recover gradually. The delivery rate stayed at 99% throughout, which is exactly why it could not have revealed the problem.
How to estimate inbox placement
Since providers do not report folder placement, senders use several indirect methods:
- Seed list tests: send to a set of test mailboxes at different providers and see where the message lands. Useful for spotting provider-specific problems, but test mailboxes have no engagement history, so results are approximate.
- Engagement trends by provider: if open or click rates at one provider drop sharply while others stay stable, mail is probably going to spam there.
- Google Postmaster Tools: shows Gmail spam rate, authentication and compliance for domains with enough volume.
- Feedback from real recipients: ask a few colleagues or friendly customers at different providers to report where messages arrive.
- Authentication results in headers: not placement directly, but failures here almost always lead to spam placement.
Open rates have become less reliable because some mail apps load images automatically, which records “opens” that did not happen and hides real ones. Use clicks, replies and conversions alongside opens when you judge trends.
Improving both numbers
For delivery rate:
- Use confirmed opt-in and validate addresses at sign-up.
- Remove hard bounces immediately and suppress repeated soft bounces.
- Resolve blocklist listings at the source.
- Make sure every sending system is authenticated before enforcing DMARC.
For deliverability:
- Authenticate with SPF, DKIM and DMARC aligned to your domain.
- Keep complaint rates low: clear consent, recognisable sender, one-click unsubscribe.
- Send to engaged recipients and prune long-inactive contacts.
- Separate marketing from transactional mail.
- Warm up new domains and IPs gradually.
Reporting e-mail performance honestly
If you report e-mail results to a manager or client, show both kinds of numbers. A dashboard with only “delivered” and “opened” invites wrong conclusions. A more honest set includes bounce rate, complaint rate, click rate per provider, authentication status and, where available, seed test or Postmaster Tools data. When one of them moves, the others usually explain why.
For agencies, this is also good protection. Deliverability problems often originate outside the campaign, in DNS records or a client’s other sending tools, and showing authentication status regularly makes such problems visible before they are blamed on the content.
Checking the technical side
Authentication is the most controllable input to deliverability and the easiest to verify from outside. Site AI Audit checks SPF with its lookup limit, DKIM, DMARC and MX records and explains any issue in plain words, together with the website’s SSL, speed and SEO. A free check confirms whether the technical side supports good placement; paid plans on the pricing page monitor it and alert you when something changes.
Related reading
- Why Are My Emails Going to Spam? 12 Causes and Fixes
- Email Bounce Codes Explained: Hard vs Soft Bounces and Fixes
- Google Postmaster Tools: How to Set It Up and Read the Data
The bottom line
Delivery rate tells you the server accepted your mail; deliverability tells you whether anyone is likely to see it. Keep bounces low with clean lists, and keep placement high with authentication, reputation and wanted content. Report both, because a high delivery rate can hide a spam-folder problem for months.
FAQ
What is a good e-mail delivery rate?
For permission-based lists, delivery rates are typically very high, with bounces at a small fraction of sent mail. A noticeable drop usually signals list quality problems or blocking.
Does “delivered” mean the e-mail reached the inbox?
No. Delivered means the receiving server accepted it. The message may still have gone to the spam or junk folder.
How can I check inbox placement?
Use seed tests across providers, compare engagement by provider, check Google Postmaster Tools, and ask real recipients where messages arrive. No single method is exact.
Is the Gmail Promotions tab bad for deliverability?
Promotions is part of the inbox, not spam. It reflects the type of content. Recipients who want your mail find it there, and trying to trick filters into the Primary tab rarely works for long.
Why did my open rate change without anything else changing?
Privacy features in some mail apps load images automatically or block tracking, which distorts open rates. Use clicks, replies and conversions to confirm trends.
Which matters more, delivery rate or deliverability?
Both matter, but deliverability determines whether mail is seen. A high delivery rate with poor placement still means customers miss your messages.