ENEnglish
 LTLietuviškai
 DEDeutsch
 FRFrançais
 RUРусский
 ESEspañol
 PLPolski
 ITItaliano
 UKУкраїнська
 CSČeština
 PTPortuguês
 JA日本語
JA日本語 LVLatviešu valoda
 ETEesti
 HUMagyar
 IDBahasa Indonesia
 TRTürkçe
 HIहिन्दी
 ELΕλληνικά
 ARالعربية
 THไทย
THไทย VITiếng Việt
 RORomână
 MSBahasa Melayu
 BNবাংলা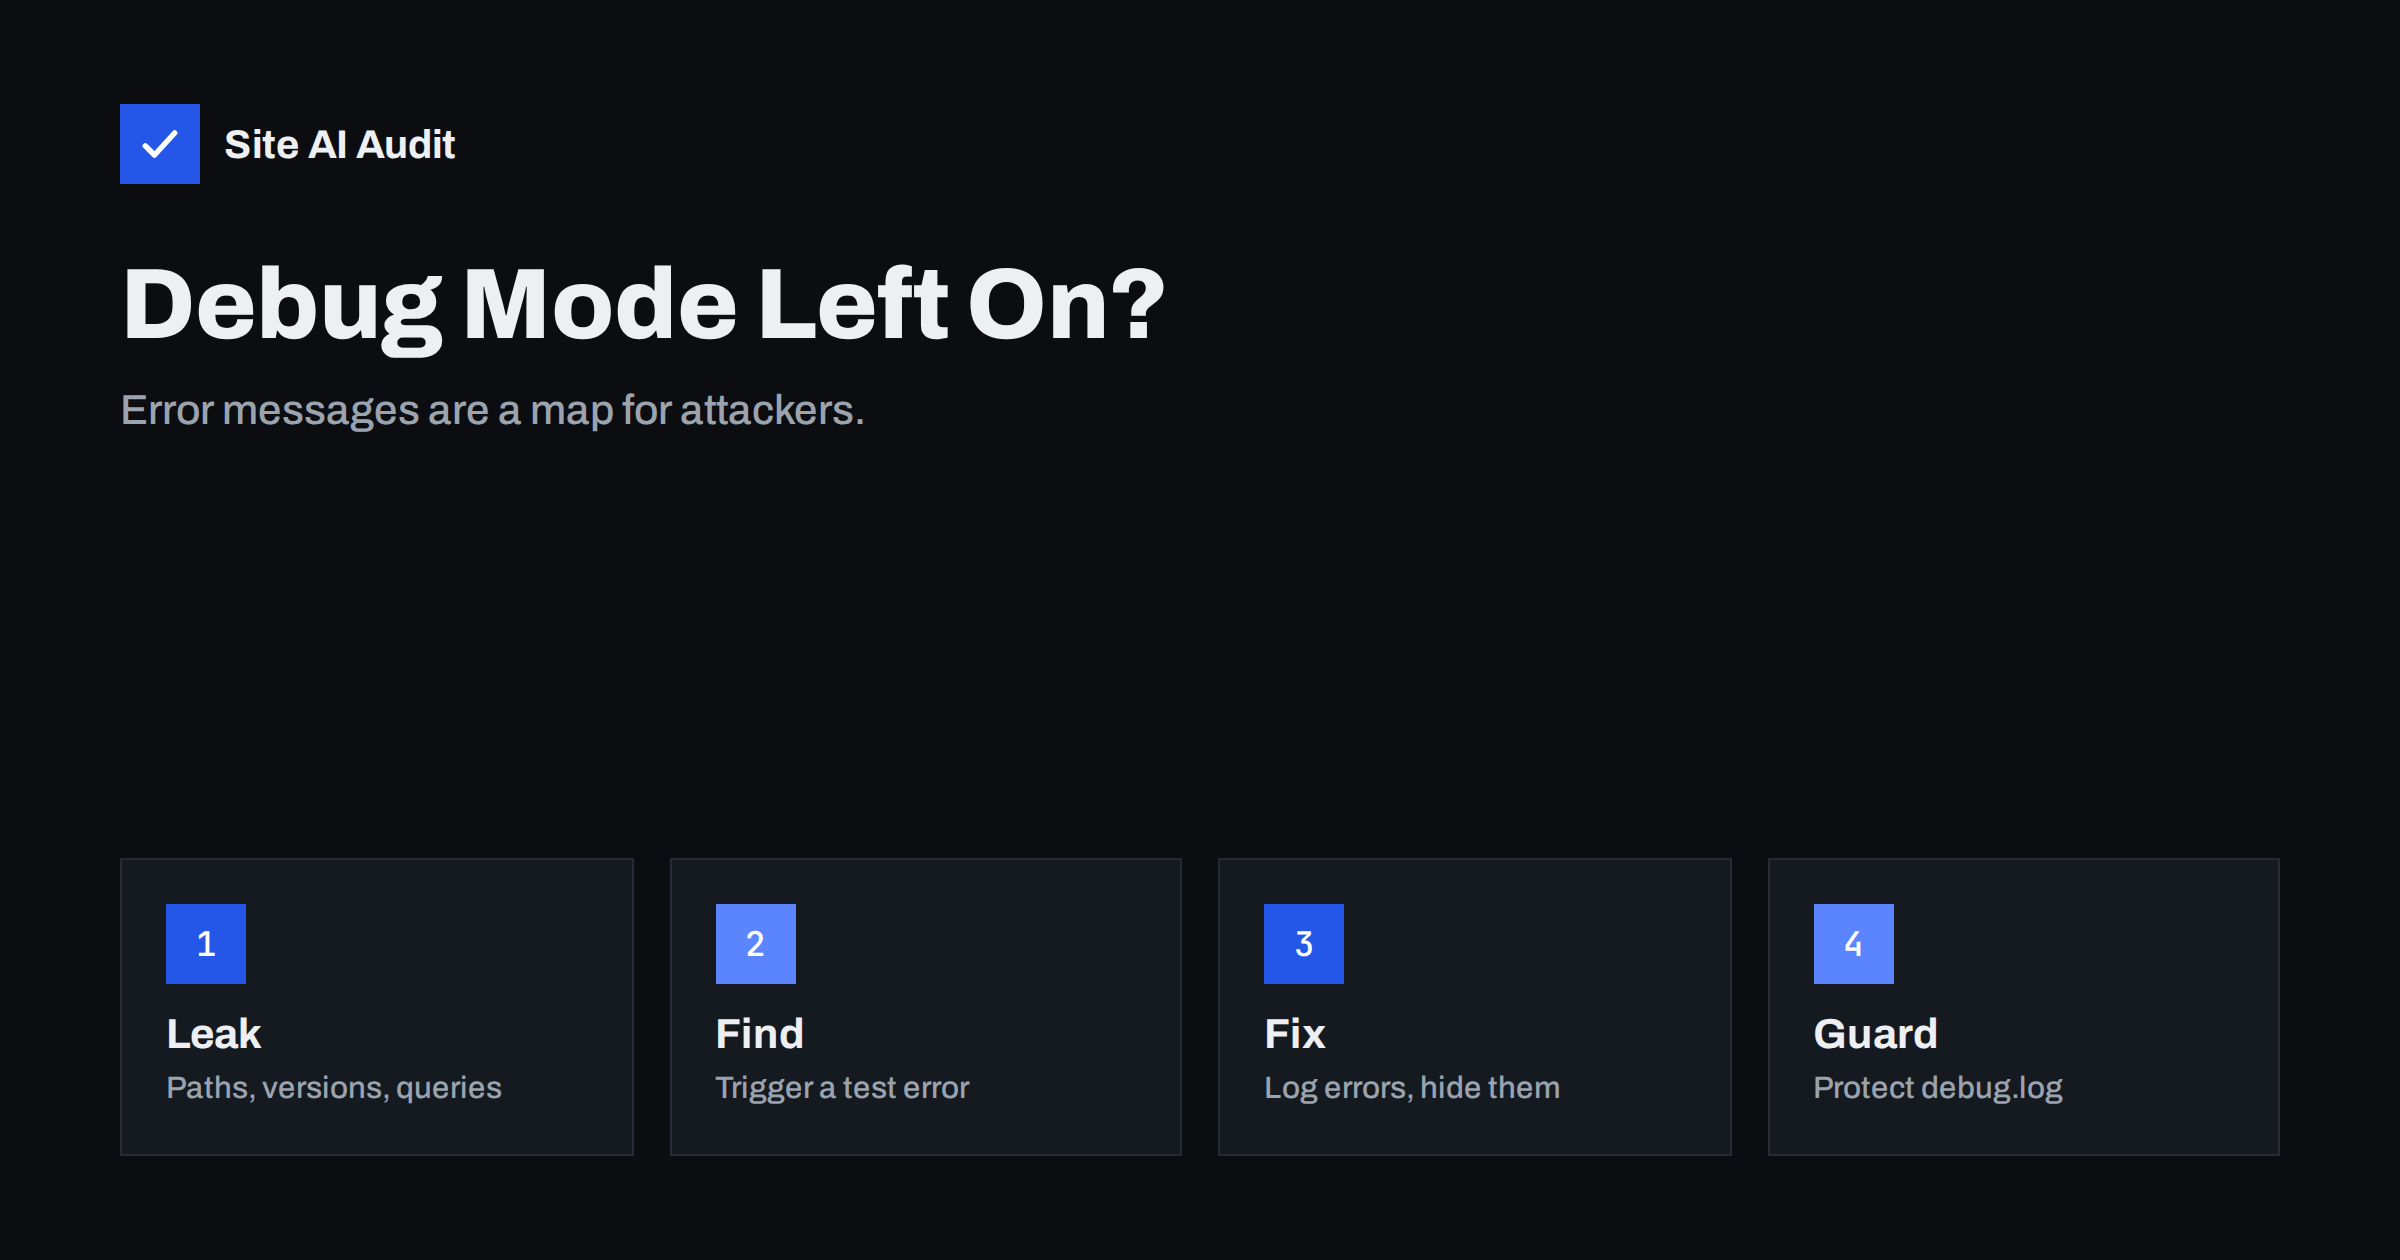
Short answer: When a website shows raw error messages, stack traces or debug output to visitors, it reveals file paths, software versions, database names and sometimes parts of queries or settings. Attackers use that information to choose and tune their attacks. The fix is to turn debug display off on live sites, write errors to a log file that cannot be reached from the web, show visitors a friendly error page and test the result by triggering a harmless error.
What exposed errors look like
Developers need detailed errors while they build a site. The problem starts when the same detail appears on the live website. You may have seen messages like these:
- A line starting with “Warning:” or “Fatal error:” that names a file such as
/var/www/html/wp-content/plugins/...and a line number. - A database error that includes part of an SQL query or the name of a table.
- A long stack trace listing function names, classes and folders.
- A framework debug page with environment variables, configuration values or a code editor view.
- A page that prints the output of
phpinfo(), which lists the entire server configuration.
Sometimes the message appears only when a rare action goes wrong, such as an empty form field or a broken plugin after an update, so the owner never sees it but visitors and scanners do.
Why it is a security risk
An error message is information that was never meant to be public, and attackers collect such details before they attack. This type of weakness is called information disclosure or improper error handling, and OWASP describes it in its note on improper error handling. What can leak:
- Server paths. They show the directory layout, the hosting account name and which plugins are installed, which helps with attacks such as path traversal.
- Software names and versions. They tell attackers which known flaws to try. See how to hide server software versions.
- Database details. Messages can confirm that user input reaches a query, which is a sign of SQL injection risk.
- Secrets. Debug pages in some frameworks show environment variables, which can include passwords and API keys.
- Logic. Stack traces show how your code is organised and where to push.
Detailed errors do not break into a site by themselves, but they make every other attack faster and more precise.
Where debug output leaks
Look at these places, because the leak is not always on the page itself:
- On-screen PHP errors. Controlled by the
display_errorssetting in PHP. - WordPress debug mode. The constants
WP_DEBUGandWP_DEBUG_DISPLAYinwp-config.phpcontrol whether notices and warnings appear on pages. - The debug log file. When
WP_DEBUG_LOGis on, WordPress writes towp-content/debug.logby default, and that file is reachable by URL unless your server blocks it. It can contain paths, user names and plugin errors. - Framework debug modes. Laravel (
APP_DEBUG), Django (DEBUG), Symfony (thedevenvironment), Node.js (NODE_ENV) and ASP.NET (custom errors) all have settings that must differ between development and production. - Left-over test files. Files such as
info.phporphpinfo.php, test scripts and debug toolbars. - Unfiltered API responses. A JSON API that returns the raw exception message with each failure.
- Staging settings copied to production. A configuration copied from a development site often keeps debug mode on.
Our guide to exposed .env, .git and backup files covers related files that should never be public.
How to check your own site
You can test in a few minutes without any special tools:
- Request a page that does not exist and look at the response. It should show your normal 404 page, not a server or framework error with technical details.
- Try an odd URL parameter on a search or form page, such as a very long value or a character like a single quote, and see whether an error with technical text appears. Only do this on your own site.
- Open
/wp-content/debug.logon a WordPress site. You should get a 403 or 404, never the contents of the file. - Look for test files such as
/info.phpand/phpinfo.php. - View the page source and search for “Warning”, “Notice”, “Stack trace” and “SQLSTATE”, which sometimes hide in HTML comments.
- Check the response headers for lines that reveal software versions.
If you find any of these, treat it as a task for today, not for next month. Ask your hosting provider for help if you cannot change the PHP settings yourself; most hosts offer a simple switch in the control panel.
How to turn debug off on a live site
The exact steps depend on your platform, but the principle is the same everywhere: log errors, do not display them.
PHP. Set display_errors = Off and log_errors = On in php.ini or in your hosting control panel, and point error_log to a file outside the public web folder.
WordPress. In wp-config.php, set WP_DEBUG to false on a live site. If you need to debug something, set WP_DEBUG_DISPLAY to false and WP_DEBUG_LOG to true, and then fix the issue quickly and turn it off again. The WordPress documentation on debugging in WordPress explains the options, including how to write the log to a different path. Delete old debug.log files when you finish.
Frameworks. Use the production setting: APP_DEBUG=false in Laravel, DEBUG = False in Django, the prod environment in Symfony, NODE_ENV=production in Node.js. Also make sure the debug toolbar or error page packages are not installed or enabled in production.
Everything else. Remove phpinfo() pages and test scripts, and block access to log files and backups with server rules. If you use WordPress, our WordPress security checklist lists the other hardening steps.
Show visitors something useful instead
Hiding the details should not leave visitors with a blank page. Provide a clear error page for 404 and 500 responses, in the style of your site, with a search box, links to popular pages and a way to contact you. Our guide to a custom 404 page explains how. Make sure that real errors still return the correct status code, because search engines treat repeated server errors as a reliability problem; see server errors in Search Console.
Keep the details for yourself. Send errors to a log, and review it, or use an error monitoring tool that alerts you when new exceptions appear. A site that quietly logs problems is both safer and easier to fix than one that shows them to the world.
A final word on timing. Errors that appear only occasionally are the most dangerous, because nobody notices them. After every plugin update, theme change or server upgrade, open a few key pages, submit a form and test the search function. Five minutes of checking after a change is cheaper than finding out from a security report months later.
Prevent it from coming back
- Keep development, staging and production configurations separate, and review settings whenever you deploy or copy a site.
- Add “debug is off” to your launch checklist. Our website security audit checklist is a good template.
- Keep staging sites private with a password so that their errors and test content are not public or indexed; see staging site indexed by Google.
- Delete debug logs, test scripts and old plugins after use.
- Review the logs regularly. Repeating errors often show a plugin that needs an update or removal.
How Site AI Audit helps
Site AI Audit checks the visible security basics from the outside: the SSL certificate, the HTTPS redirect, security headers and whether the server or WordPress reveals software versions, which is the same kind of information that error messages leak. It crawls up to 50 pages on the free check and lists pages that responded with errors or did not respond at all. It does not trigger errors on purpose or read your log files, so run the manual checks above as well. You can run a free check, and the pricing page lists plans with monitoring.
Related reading
- Website Security for Small Businesses: Where to Start
- 9 Signs Your Website Has Been Hacked (and How to Check)
- Why Upgrading PHP Makes Your Website Faster (and Safer)
- Directory Listing Enabled? How to Disable It on Any Server
The bottom line
Debug output belongs in a log file, not on a public page. Turn debug display off on every live site, protect or remove log files, show visitors a friendly error page and test with a harmless broken request. It takes minutes and removes a free source of information for attackers.
DUK
Is WP_DEBUG safe to leave on?
Not on a live site. It can print warnings and file paths to visitors. Use it on a staging copy, and if you must debug live, log errors without displaying them and switch it off again afterwards.
Can anyone read my debug.log file?
Possibly. WordPress writes it inside the web-accessible wp-content folder by default, so unless your server blocks it, anyone who knows the URL can open it. Move it elsewhere or delete it when you finish.
Do error messages affect SEO?
They can. Visible warnings spoil the page, and server errors that Googlebot meets repeatedly may reduce how often your site is crawled. Fix the cause and return correct status codes.
What should a good error page include?
A clear message, your normal navigation, a search box, links to key pages and contact details. It should not show file paths, query text or software names.
How do I know if my site leaks versions?
Look at the response headers, the page source and error pages for names and version numbers of your server, PHP, WordPress and plugins. Hide what you can and keep the software up to date.