ENEnglish
 LTLietuviškai
 DEDeutsch
 FRFrançais
 RUРусский
 ESEspañol
 PLPolski
 ITItaliano
 UKУкраїнська
 CSČeština
 PTPortuguês
 JA日本語
JA日本語 LVLatviešu valoda
 ETEesti
 HUMagyar
 IDBahasa Indonesia
 TRTürkçe
 HIहिन्दी
 ELΕλληνικά
 ARالعربية
 THไทย
THไทย VITiếng Việt
 RORomână
 MSBahasa Melayu
 BNবাংলা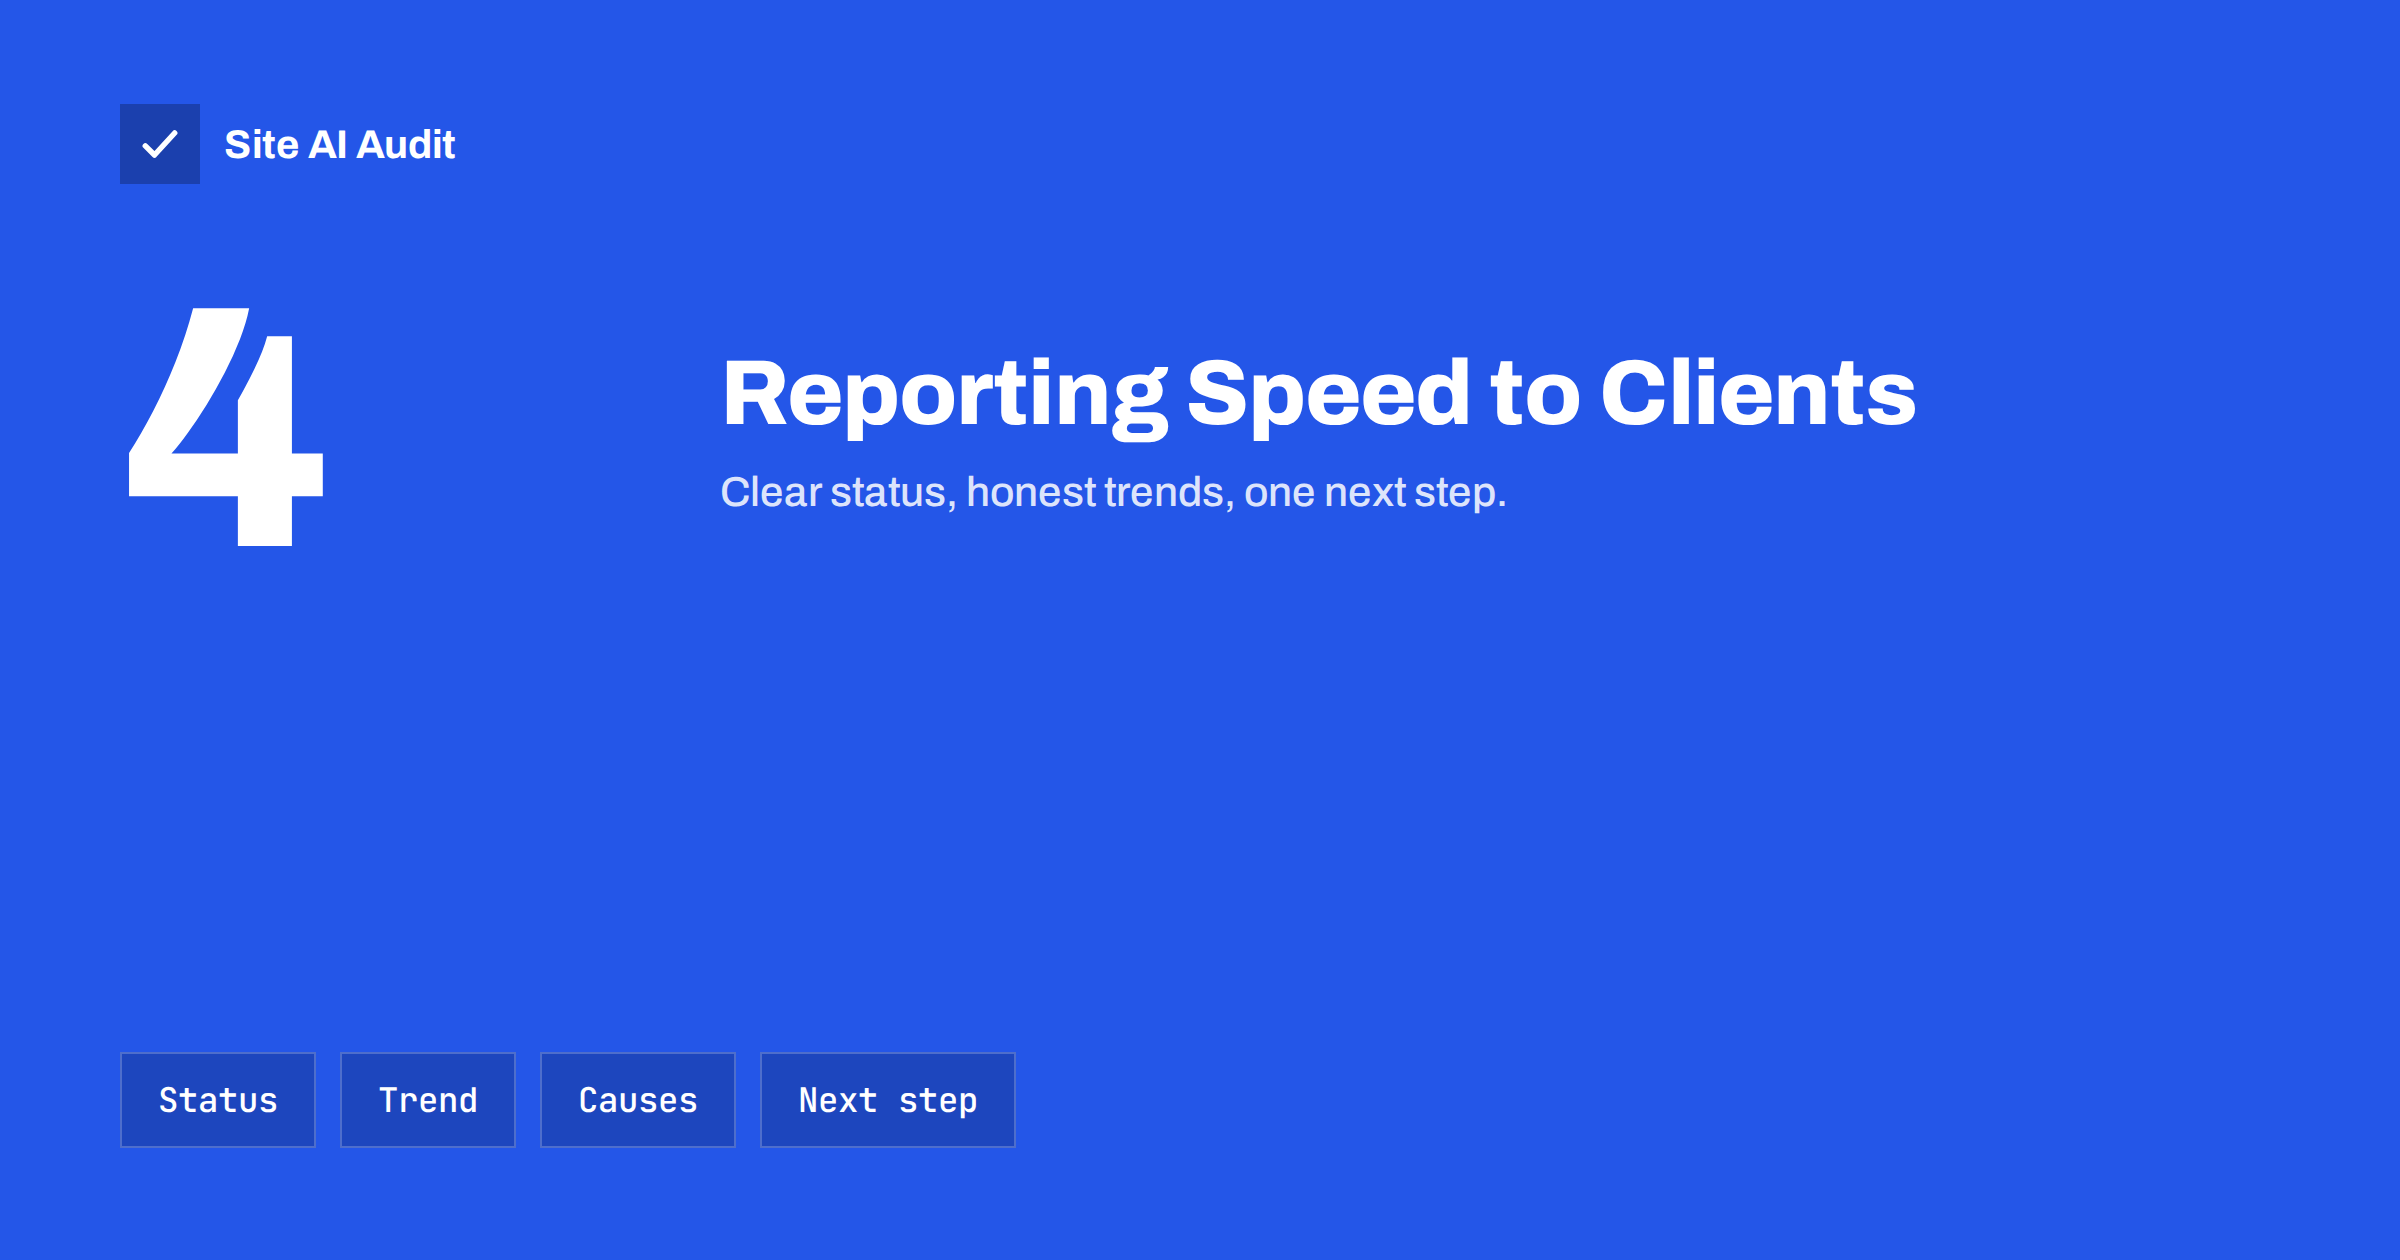
Short answer: A good website speed report for a client answers four questions in plain language: does the site pass Core Web Vitals on mobile for real users, what changed since the last report, what caused any change, and what will be done next. Use field data from Google as the headline, a small table of lab metrics for a fixed set of key pages as supporting detail, a short change log and one or two prioritised actions with an owner. Avoid long tool screenshots, lab scores as the main number and promises about rankings.
Agencies measure speed constantly, but many clients still do not understand whether their website is fast, why it matters, or what the agency is doing about it. The problem is rarely the data. It is the report: forty lines of audit output, a coloured score that jumps around, and acronyms that mean nothing to a business owner. A clear report builds trust, justifies maintenance fees and makes it easier to get approval for the changes that actually help.
Start with what the client cares about
Clients rarely care about Largest Contentful Paint as such. They care about enquiries, sales, their visitors’ experience, and whether the site is “OK”. Frame the report accordingly:
- Status: is the site fast enough for real visitors, especially on phones?
- Trend: is it getting better, worse or staying stable?
- Risk: is anything likely to cause problems soon?
- Action: what are we doing, and does the client need to decide anything?
Use field data as the headline
Lab scores change from run to run and do not reflect what Google uses. Field data does. Lead with the Core Web Vitals assessment on mobile from PageSpeed Insights or Search Console: passed or not passed, and which metric is the issue if not. If the site has too little traffic for field data, say so and explain that you are using lab data as a guide.
A one-line headline works well: “Your site passes Core Web Vitals on mobile for real visitors. No action needed on speed this month.” Or: “Mobile visitors see the main content too late on product pages (LCP). We plan to fix the image delivery this month.”
Keep a fixed set of pages and settings
Choose four to six pages that represent the site: home, main landing page, a typical article, a product or service page, and the contact or checkout page. Test them every time with the same tool, location, device and connection settings. Only then are month-to-month changes meaningful. Record:
| Metric | Why include it |
|---|---|
| LCP (lab and field) | How quickly the main content appears |
| CLS | Whether the layout is stable |
| INP (field) / TBT (lab) | How responsive the page is |
| Tempo di risposta del server | Early warning for hosting and caching problems |
| Page weight | Catches heavy images and new scripts |
Show last period and this period side by side. Mark changes beyond normal variation, and ignore small fluctuations.
Explain causes in plain language
When something changed, explain it in terms the client understands:
- Not “LCP increased due to render-blocking resources”, but “the page shows its main picture later because a new marketing script now loads first”.
- Not “CLS 0.24”, but “content jumps when the cookie banner appears, which can make people tap the wrong thing”.
- Not “TTFB degradation”, but “the server takes longer to respond, probably because the hosting plan is at its limit during busy hours”.
Link each change to an event where possible: a plugin update, a new campaign tag, a redesign of a page, a hosting incident. A change log makes this easy.
Prioritise one or two actions
End with a short, prioritised plan rather than a long list of recommendations. For each action, state:
- what will be done;
- what it should improve and roughly by how much, if you can estimate honestly;
- who does it (agency, client, host);
- whether the client needs to approve anything, such as removing a slider or a marketing tag.
Clients act on two clear recommendations; they ignore twenty. Keep the rest of your findings in an internal backlog and bring them up one or two at a time in later reports, when the first actions are done.
What to leave out
- Screenshots of full audit reports. They overwhelm and hide the key points.
- The lab score as the main number. It fluctuates and invites the wrong goal of “getting 100”.
- Ranking promises. Speed is one of many signals; promising rankings sets you up for disappointment.
- Invented or borrowed statistics about how much revenue a second is worth. Use the client’s own data if you want to discuss impact.
- Unexplained acronyms. Define LCP, CLS and INP once in simple words, or avoid them.
Handling difficult conversations
Speed problems are often caused by things the client asked for: a video background, a slider with ten slides, a chat widget, several tracking pixels. Present these as trade-offs, not mistakes. Show the measured cost, propose a lighter alternative that preserves the goal, and let the client decide. A before-and-after test on a staging copy is the most persuasive argument you can bring.
Also be honest about limits. Some slowness comes from platforms or vendors the agency cannot change, such as a booking system or a payment provider. Say so, and focus on what can be controlled, such as loading those tools only where needed.
Reporting after a speed project
A one-off speed project needs a slightly different report from monthly maintenance. The client paid for an improvement and wants to see it. Show the baseline you recorded before any change, the same measurements afterwards with identical settings, and a short list of what was done. Be clear that lab results change immediately, while real-user field data takes about four weeks to reflect the improvement, and schedule a short follow-up to show the field data once it has caught up. That follow-up is often the most convincing part of the whole project, because it shows the change in terms of real visitors rather than test numbers.
If some goals were not reached, say so and explain why: a third-party booking widget that cannot be changed, a hosting limitation or a design element the client chose to keep. Clients accept limits when they are explained honestly; they lose trust when a report quietly skips them.
A simple one-page report template
- Headline: one sentence on overall status.
- Core Web Vitals (mobile, field): passed or not, and which metric.
- Key pages table: LCP, CLS, TBT or INP, server response and page weight, this period and last.
- What changed: short list from the change log.
- Issues found: one to three, in plain language.
- Next steps: one or two actions with owners and any decisions needed.
- Other health checks: SSL expiry, broken pages, e-mail authentication, if you monitor them.
Reporting speed as part of overall website health
Speed is rarely the only thing clients need to hear about. An expiring SSL certificate, broken links, missing DMARC or pages accidentally set to noindex can cost more than a slow page. Combining speed with these checks in one short health report gives clients a complete picture and shows the full value of ongoing maintenance. It also helps you prioritise honestly: if the certificate expires next week, that belongs at the top of the report, above any speed improvement, and the client will appreciate being warned in time.
How Site AI Audit helps
Site AI Audit produces one report covering speed (Google PageSpeed for mobile, Core Web Vitals, server response, compression and page weight), SEO basics, SSL and security headers, and SPF, DKIM and DMARC, with every finding explained in plain words and ranked by impact. The Agency plan adds reports with your own logo and an embeddable audit form for lead generation, alongside unlimited re-checks and monitoring. See the plans for details.
Related reading
- Website Speed Monitoring: Catch Slowdowns Before Customers Do
- PageSpeed Insights vs GTmetrix vs WebPageTest: Which to Use
- Core Web Vitals Explained for Small Business Websites
- SEO Audit Checklist for Small Business Websites
The bottom line
A useful speed report is short, honest and actionable. Lead with real-user Core Web Vitals on mobile, track a fixed set of pages with consistent settings, explain changes in plain language, and end with one or two clear actions. Leave out raw audit dumps, lab scores as headlines and ranking promises. Clients who understand the report are the ones who approve the fixes.
FAQ
What should a website speed report include?
The Core Web Vitals status on mobile from field data, a small table of key metrics for a fixed set of pages compared with the previous period, what changed and why, and one or two prioritised next steps with owners.
Should I show clients the PageSpeed score?
You can include it as a secondary detail, but not as the headline. It varies between runs and is not used by Google Search. Field Core Web Vitals are a more meaningful and stable measure.
How often should agencies report on website speed?
Monthly is usual for maintenance clients, with extra checks after significant changes such as redesigns, plugin updates or new marketing tools. Field data changes slowly, so more frequent reporting adds little.
How do I explain Core Web Vitals to a non-technical client?
Describe them as three questions: does the main content appear quickly, does the page stay still while loading, and does it react quickly when tapped. Then say whether the site passes each one.
What if the client’s own requests slow down the site?
Present the measured cost of the feature and a lighter alternative that achieves the same goal. A before-and-after test on staging makes the trade-off concrete and lets the client decide.