ENEnglish
 LTLietuviškai
 DEDeutsch
 FRFrançais
 RUРусский
 ESEspañol
 PLPolski
 ITItaliano
 UKУкраїнська
 CSČeština
 PTPortuguês
 JA日本語
JA日本語 LVLatviešu valoda
 ETEesti
 HUMagyar
 IDBahasa Indonesia
 TRTürkçe
 HIहिन्दी
 ELΕλληνικά
 ARالعربية
 THไทย
THไทย VITiếng Việt
 RORomână
 MSBahasa Melayu
 BNবাংলা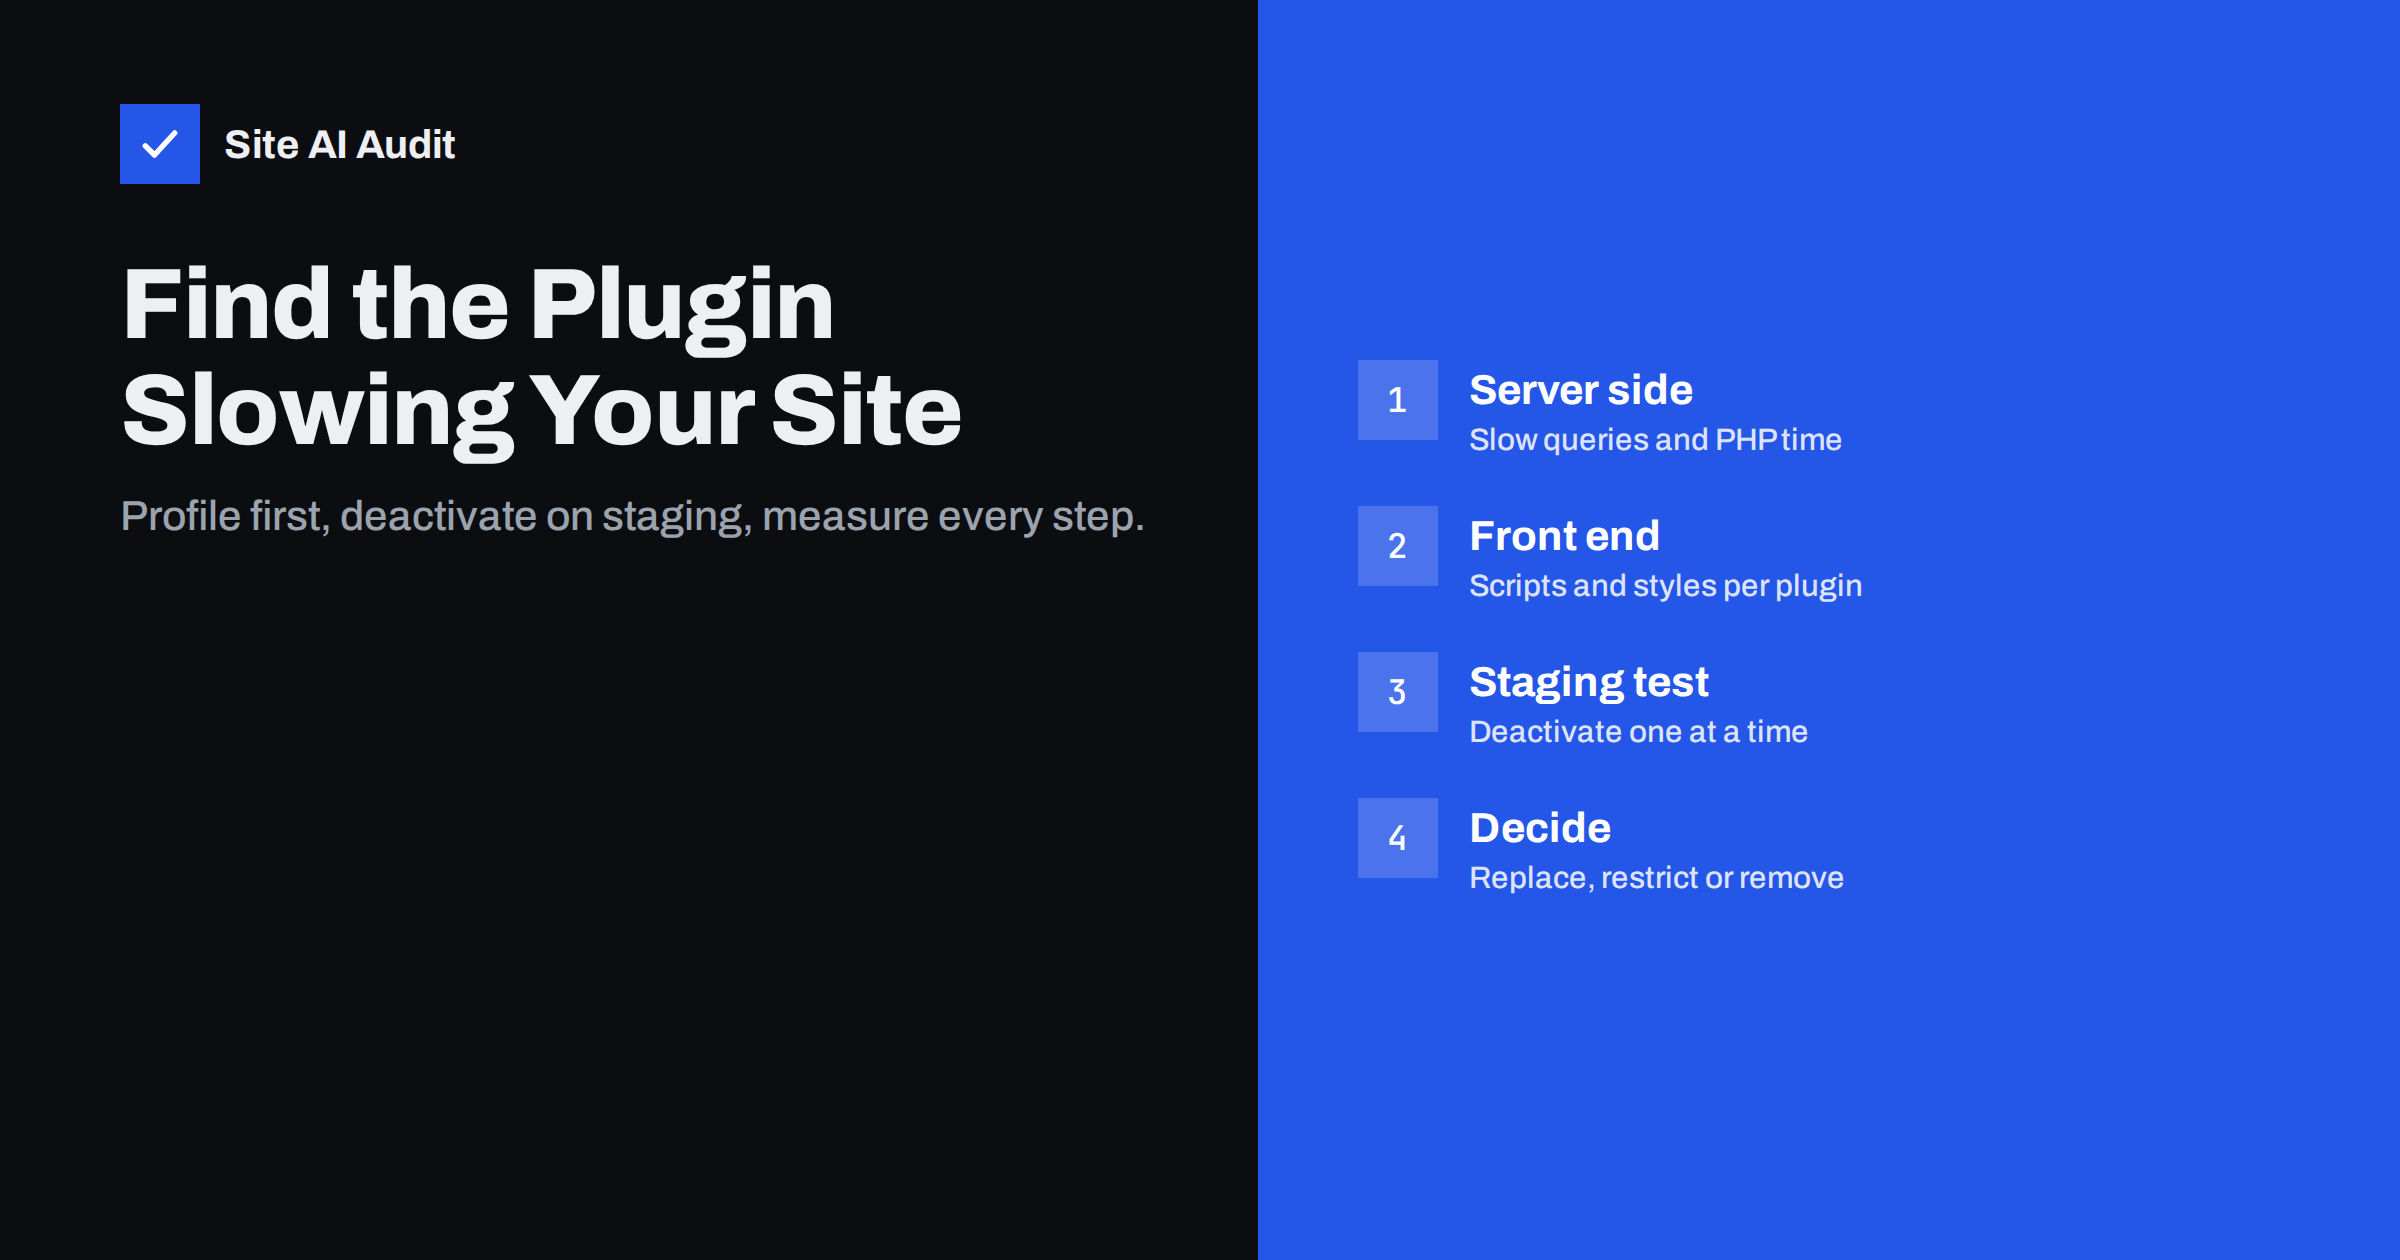
Short answer: To find which WordPress plugin slows your site, split the problem into server-side and front-end cost. For server-side slowness, use a profiling plugin such as Query Monitor to see slow database queries, HTTP calls and which plugin caused them. For front-end slowness, use the browser’s Network and Performance panels to see which plugin loads the heaviest scripts and styles. Confirm the suspect on a staging copy by deactivating plugins one at a time and measuring, then replace, restrict or remove the culprit.
“Too many plugins” is the usual explanation for a slow WordPress site, and it is only half true. The number of plugins matters much less than what they do. Twenty small, well-written plugins can cost almost nothing, while a single plugin that runs an expensive query on every page or loads a large JavaScript bundle site-wide can add seconds. The skill is not to delete plugins at random, but to find the one or two that are responsible.
Two kinds of plugin slowness
Plugins can slow a site in two different places, and the tools for finding each are different:
| Server-side cost | Front-end cost | |
|---|---|---|
| Where it happens | On your server, while PHP builds the page | In the visitor’s browser, after the HTML arrives |
| What you notice | Slow Time to First Byte, slow admin area | Slow LCP, poor INP, heavy pages |
| Typical causes | Slow database queries, external API calls, heavy processing | Large scripts and styles, widgets, fonts, embeds |
| Hidden by page caching? | Mostly, for cached pages | No |
| Tools | Query Monitor, server logs, host’s APM | DevTools Network, Coverage and Performance panels |
Check which kind of problem you have first. If Time to First Byte is fast but the page is still slow to appear or respond, focus on the front end. If the server response itself is slow, especially on uncached pages or in the admin, focus on the server side.
Finding server-side culprits with Query Monitor
Query Monitor is a free developer plugin that shows, for the current page, all database queries, PHP errors, hooks, HTTP API calls and more, grouped by the plugin or theme that triggered them.
- Install and activate it, ideally on a staging copy.
- Load a slow page while logged in as an administrator; the toolbar shows total page generation time, memory and query count.
- Open “Queries by Component” to see how many queries and how much query time each plugin caused.
- Check “Slow Queries” for individual queries that take a long time.
- Check “HTTP API Calls” for requests to external services made while building the page. A slow third-party API can stall every request.
- Repeat on several page types: home, a post, a product, the cart, and slow admin screens.
Deactivate Query Monitor when you are done; it adds overhead of its own and is not meant to run permanently on production.
Other server-side signs to look for
- Large autoloaded options. Some plugins store big arrays in options that WordPress loads on every request. Query Monitor and database tools can show the largest autoloaded options and their owner.
- Heavy scheduled tasks. Plugins that run imports, backups, statistics or link checks via WP-Cron can slow the site whenever they run.
- Admin-ajax and REST requests. Plugins that poll the server regularly, for example for live statistics or notifications, add load even when nobody is looking.
- Your host’s tools. Many managed hosts provide application performance monitoring that shows slow transactions and the plugins responsible over time, not just on one page view.
Finding front-end culprits in the browser
- Open the page in a private window, open DevTools and go to the Network panel.
- Filter by JS, then by CSS, and sort by size. File paths usually reveal the plugin:
/wp-content/plugins/plugin-name/.... - Use the Coverage tab to see how much of each plugin’s code is unused on this page.
- Record a load in the Performance panel with CPU throttling, and look at long tasks. The call tree shows which script files consume the most time.
- Note plugins that load assets on pages where their feature is absent, such as a form plugin on every blog post or a slider plugin on pages without sliders.
Confirming the suspect on staging
Profiling tools point to suspects; a controlled test confirms them. Never do this on a live shop or busy site.
- Create a staging copy. Many hosts offer one-click staging. Otherwise, use a backup and migration plugin to clone the site.
- Measure a baseline on staging: TTFB for an uncached page, LCP and Total Blocking Time for a few key pages.
- Deactivate the prime suspect and measure again. If the numbers improve substantially, you have found a culprit.
- If not, deactivate plugins one at a time (or in halves, to narrow down faster) and re-measure after each step.
- Note dependencies. Some plugins only matter in combination, for example a caching plugin and an optimisation plugin fighting each other.
- Also test the theme by switching temporarily to a default theme. Sometimes the theme or its bundled page builder is the heaviest component.
What to do once you find the culprit
- Configure it. Many plugins have settings that disable unneeded features, reduce logging or stop loading assets globally.
- Restrict it. Load its assets only on the pages that use it, with an asset-management plugin or a few lines of code.
- Update it. Performance problems are often fixed in newer versions; check the changelog.
- Replace it. A lighter plugin, a built-in WordPress feature or a small custom snippet may do the same job.
- Remove it. If nobody uses the feature, deactivate and delete it.
- Report it. A clear report to the plugin developer with Query Monitor data can lead to a fix for everyone.
An example investigation
Suppose a company blog loads quickly for cached visitors, but new posts take several seconds to appear the first time and the editor feels sluggish. Query Monitor on an uncached post shows page generation time well over a second, with one component responsible for most of the query time: a related-posts plugin that compares every post’s content on each view. Deactivating it on staging brings generation time down sharply. The fix is not necessarily to lose the feature: the plugin’s settings allow pre-computed results that refresh once a day, or a lighter alternative based on shared tags can replace it. After the change, the team measures again, confirms the improvement and adds a note to the plugin register explaining why the setting must stay on.
Plugin categories that often cost the most
- Page builders and multipurpose addon packs.
- Sliders, galleries and animation plugins.
- Related-posts plugins that run complex queries on each view.
- Statistics and analytics plugins that log visits in the WordPress database.
- Security plugins with heavy live traffic logging.
- Social sharing and social feed plugins that load external scripts.
- Broken-link checkers and backup plugins running on busy schedules.
This does not mean these plugins are bad; many are well built. They are simply the categories where a closer look usually pays off.
Prevent the problem from returning
Keep a simple plugin register: name, purpose, owner, date installed and the pages that use it. Before installing a new plugin, test it on staging and compare speed metrics before and after. Review the list twice a year and remove what nobody needs. This habit prevents the slow build-up that makes sites heavier every year without any single decision looking harmful.
How Site AI Audit helps
Site AI Audit shows the symptoms from the outside: slow server response, weak Core Web Vitals in Google PageSpeed for mobile, heavy pages and missing compression, together with SEO, SSL and e-mail checks. That tells you whether to look for a server-side or a front-end culprit before you open Query Monitor. Paid plans add re-checks, so you can confirm the fix worked, and weekly monitoring to catch the next slow plugin early; see the plans.
Related reading
- How to Fix a Slow WordPress Site: A Step-by-Step Guide
- How to Reduce Unused JavaScript and Speed Up Your Pages
- How to Reduce Server Response Time (TTFB) for Faster Pages
- How to Speed Up a Slow WooCommerce Store Without Breaking It
The bottom line
Do not count plugins; measure them. Decide whether the slowness is on the server or in the browser, use Query Monitor or DevTools to find suspects, confirm on staging by deactivating one at a time, and then configure, restrict, replace or remove the culprit. A plugin register and a quick test before each installation keep the problem from coming back.
FAQ
How many plugins is too many for WordPress?
There is no fixed number. A site with thirty lightweight plugins can be faster than one with five heavy ones. Measure the cost of each plugin rather than counting them.
Do deactivated plugins slow down WordPress?
Deactivated plugins do not run, so they do not slow down the front end. They can still be a security risk if outdated, so delete plugins you no longer need. Some leave data in the database, which is usually harmless.
Is Query Monitor safe to use on a live site?
It is widely used and only shows its output to administrators, but it adds some overhead. Use it briefly for diagnosis, preferably on a staging copy, and deactivate it afterwards.
Why is only my WordPress admin area slow?
The admin is never page-cached, so slow queries, heavy plugins, large autoloaded options and scheduled tasks show up there first. Profile admin pages with Query Monitor to see which plugin causes the load.
Can a theme slow down WordPress as much as a plugin?
Yes. Multipurpose themes and bundled page builders often load large amounts of CSS and JavaScript on every page. Temporarily switching to a default theme on staging shows how much the theme contributes.