ENEnglish
 LTLietuviškai
 DEDeutsch
 FRFrançais
 RUРусский
 ESEspañol
 PLPolski
 ITItaliano
 UKУкраїнська
 CSČeština
 PTPortuguês
 JA日本語
JA日本語 LVLatviešu valoda
 ETEesti
 HUMagyar
 IDBahasa Indonesia
 TRTürkçe
 HIहिन्दी
 ELΕλληνικά
 ARالعربية
 THไทย
THไทย VITiếng Việt
 RORomână
 MSBahasa Melayu
 BNবাংলা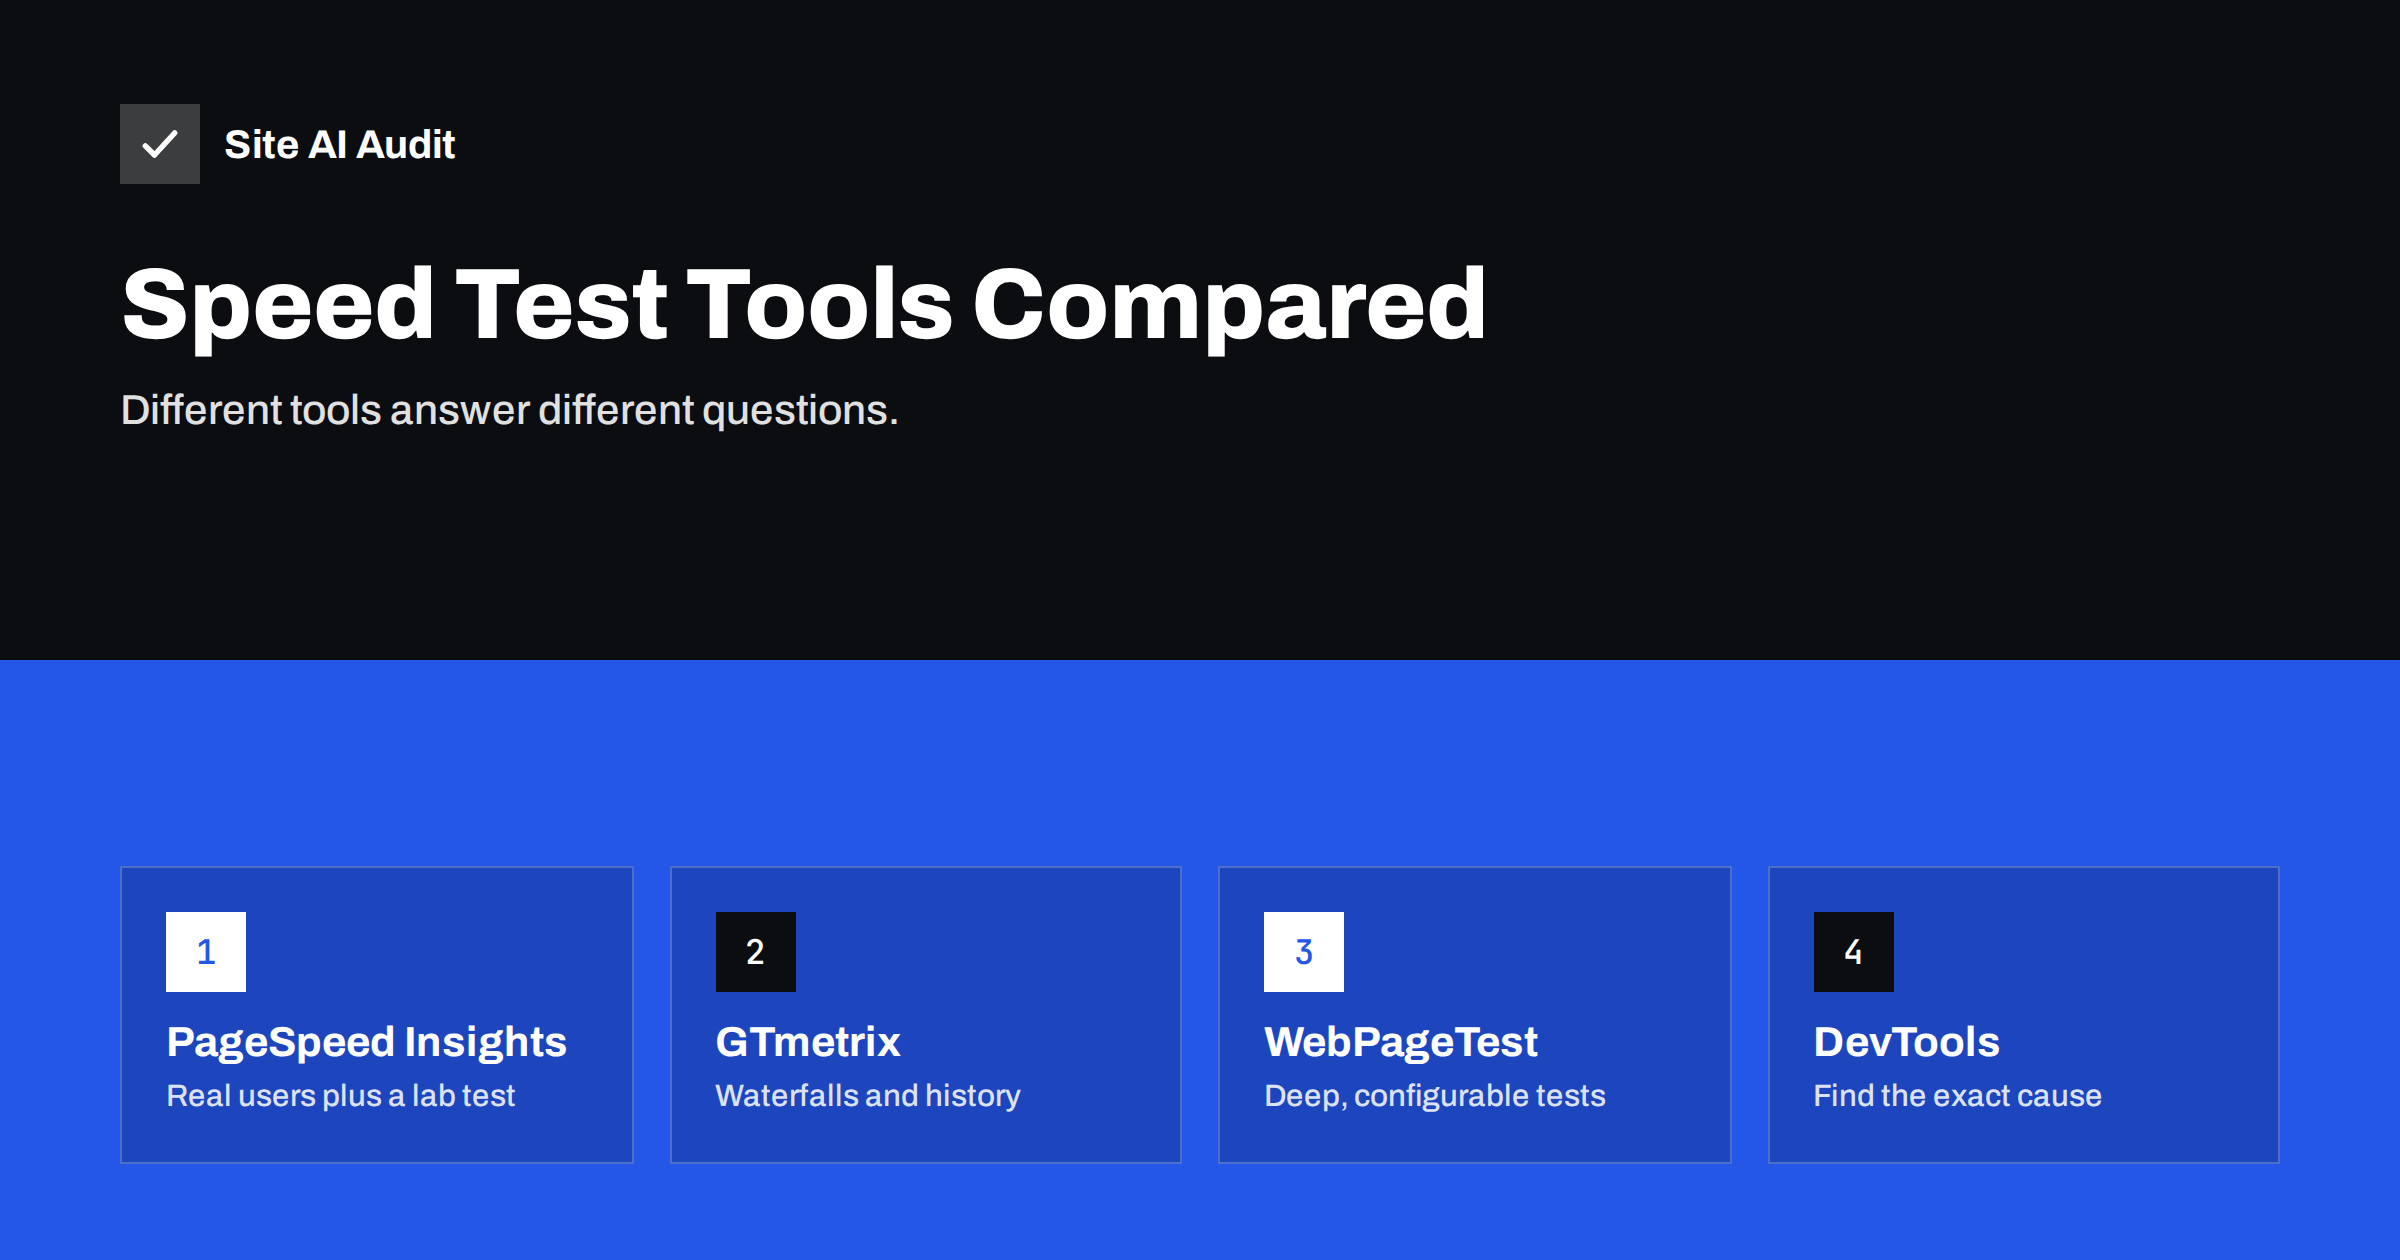
Short answer: Use PageSpeed Insights to see how real Chrome users experience your pages (field data and Core Web Vitals) plus a quick Lighthouse lab test; use GTmetrix for easy-to-read waterfalls and tracking a page over time; use WebPageTest for detailed, configurable tests from specific locations, devices and connections; and use Chrome DevTools to find the exact file or script causing a problem. Their results differ because they test from different locations, devices and network settings, and because lab tests are simulations, not real visits.
A common frustration: PageSpeed Insights says your mobile score is 42, GTmetrix gives an A, and WebPageTest shows a load time nobody can reconcile with either. Which one is right? All of them, in their own way. Each tool answers a slightly different question under different conditions. Once you know what each is designed for, the contradictions disappear and you can use them together.
Field data vs lab data: the key distinction
Before comparing tools, separate two kinds of measurement:
- Field data comes from real visitors on their own devices and networks. It tells you what people actually experience. It is what Google uses for Core Web Vitals in search. It is slow to change and cannot tell you why something is slow.
- Lab data comes from a single test in a controlled environment with a chosen device, network and location. It is reproducible and detailed, ideal for diagnosing causes and testing fixes, but it is only a simulation of one possible visit.
Most confusion about differing results comes from comparing a lab result from one tool with field data from another, or two lab tests with different settings.
PageSpeed Insights
Google’s free tool combines both kinds of data in one report.
- Field data: Core Web Vitals from the Chrome User Experience Report for the URL and the whole origin, over 28 days, for mobile and desktop.
- Lab data: a Lighthouse test run on Google’s servers with a simulated mid-range phone and throttled network for mobile.
- Strengths: the only quick way to see the field data Google uses; free; clear recommendations with estimated savings.
- Limitations: little control over test location and settings; lab scores vary between runs; no field data for low-traffic pages.
- Best for: knowing where you stand with Core Web Vitals and getting a prioritised first list of fixes.
Lighthouse in Chrome
Lighthouse is the engine behind the PageSpeed Insights lab test, and you can also run it locally from Chrome DevTools. Local runs use your own computer and connection, with simulated throttling, so results depend on your machine and what else it is doing. Extensions and cached files can also skew results; run it in an incognito window. It is useful for testing pages that are not public, such as staging sites, and for quick checks during development.
GTmetrix
GTmetrix runs Lighthouse-based lab tests from a choice of locations and presents them with its own grading and a visual waterfall.
- Strengths: readable waterfall of every request; video and filmstrip of the load; history and monitoring on accounts; choice of test locations and devices on some plans.
- Limitations: default settings may test a desktop-like device from a location that is not near your visitors; its grade is not what Google uses; no Chrome field data.
- Best for: seeing the sequence of requests and tracking one page over time with consistent settings.
Pay attention to the test location and device settings. A test from a server near your hosting on an unthrottled connection will look much faster than PageSpeed Insights’ mobile simulation, which explains many “GTmetrix says A, PageSpeed says red” situations.
WebPageTest
WebPageTest is the most detailed of the common tools and is widely used by performance specialists.
- Strengths: many test locations, real devices and browsers, precise connection profiles; multiple runs with median results; first and repeat view; detailed waterfalls, connection views, filmstrips and main-thread breakdowns; scripting of multi-step journeys; comparison between runs.
- Limitations: more complex interface; some advanced features require an account or paid plan; results take longer.
- Best for: investigating difficult problems, testing from where your customers are, and comparing before and after with controlled conditions.
Chrome DevTools
DevTools is not a test that produces a score but a set of instruments for finding causes.
- Network panel: every request with size, timing, priority, protocol and cache status; throttling to simulate slow networks.
- Performance panel: records a load or interaction, shows long tasks, the functions that ran, layout shifts and live Core Web Vitals including INP as you interact.
- Coverage tab: shows unused CSS and JavaScript.
- Best for: answering “which file or script is responsible?” after another tool has told you there is a problem.
Search Console
Google Search Console’s Core Web Vitals report groups your site’s URLs by status using field data, and shows which groups share an issue. It is not a testing tool, but it is the best way to see site-wide field data trends and to confirm, after a month, that fixes have reached real users.
Comparison at a glance
| Tool | Field data | Lab test | Location control | Best use |
|---|---|---|---|---|
| PageSpeed Insights | Yes (CrUX) | Yes (Lighthouse) | No | Core Web Vitals status and first fixes |
| Lighthouse (local) | No | Yes | Your own machine | Development and private pages |
| GTmetrix | No | Yes | Yes, limited on free plan | Waterfalls and tracking over time |
| WebPageTest | No (except via integrations) | Yes, very detailed | Yes, many | Deep diagnosis, controlled comparisons |
| Chrome DevTools | No | Manual recordings | Your own machine | Finding the exact cause |
| Search Console | Yes (site-wide) | No | n/a | Trends and groups of URLs |
Why results differ, in one list
- Different test locations and distance from your server.
- Different device simulation: mid-range phone versus desktop.
- Different network throttling or none at all.
- Cached versus uncached pages on your server or CDN at the time of the test.
- Third-party scripts and ads that change between runs.
- Different scoring systems: a GTmetrix grade and a Lighthouse score are not the same scale.
- Field data versus lab data.
Choosing tools for agencies and teams
Agencies and in-house teams usually need more than one-off tests. They need consistent measurements across many sites and pages, results that clients or managers can understand, and a record of changes over time. A practical setup combines three layers. Field data from Search Console and PageSpeed Insights answers “are real users having a good experience?” A scheduled lab test with fixed settings, from a tool that keeps history, answers “did anything change since last week?” And a deep-dive tool such as WebPageTest or DevTools answers “why?” when something goes wrong.
Whatever you choose, document the settings: test location, device profile, connection and the exact URLs. Reports that mix different settings from month to month look like progress or regression when nothing actually changed. It also helps to agree with clients in advance which numbers count. Field Core Web Vitals on mobile are a solid primary measure, with lab scores as supporting detail rather than the headline. That avoids long discussions about why a score moved by four points between two runs on the same day.
A practical workflow
- Start with PageSpeed Insights on mobile to see field data and the main lab recommendations.
- Pick the metric that fails and read the related diagnostics.
- Use DevTools or a WebPageTest waterfall to find the exact cause.
- Fix one thing and re-test with the same tool and settings, several runs.
- After a few weeks, confirm in Search Console and PageSpeed field data that real users see the improvement.
Stick to consistent settings for before-and-after comparisons. Switching tools or locations between tests makes it impossible to tell whether your change or the test conditions caused the difference.
How Site AI Audit helps
Site AI Audit runs Google PageSpeed for mobile as one part of a broader check that also crawls up to 50 pages and covers SEO basics, SSL, security headers and e-mail authentication. Instead of raw metrics from several tools, you get findings ranked by impact and explained in plain words, which is a good starting point before opening DevTools or WebPageTest. Check your site for free.
Related reading
- How to Read a PageSpeed Insights Report Without Guesswork
- Core Web Vitals Explained for Small Business Websites
- Why Your Website Is Slow on Mobile and How to Fix It
The bottom line
No single speed tool tells the whole story. PageSpeed Insights shows real-user Core Web Vitals and a quick lab test, GTmetrix makes waterfalls and trends easy, WebPageTest gives deep control, DevTools finds the exact cause, and Search Console confirms site-wide progress. Use them together, keep settings consistent, and judge success by field data.
GYIK
Why does GTmetrix show a better result than PageSpeed Insights?
The tools usually test with different devices, network settings and locations. PageSpeed Insights’ mobile test simulates a mid-range phone on a throttled network, which is much slower than a desktop test from a nearby server. Compare like with like.
Which speed test does Google use for rankings?
None of the lab tests. Google uses field data from real Chrome users, reported as Core Web Vitals. You can see that data in PageSpeed Insights and Search Console.
Is WebPageTest better than PageSpeed Insights?
They serve different purposes. WebPageTest offers far more control and detail for diagnosis. PageSpeed Insights is quicker and shows the real-user data Google uses. Many professionals use both.
How many times should I run a speed test?
At least three runs per page and setting, using the median result. Lab results vary between runs because of network conditions, server load and third-party content.
Can I test pages that are not public yet?
Yes, with Lighthouse in Chrome DevTools, which runs on your own machine. Some online tools can also test password-protected pages with the right settings. Remember that local results depend on your computer and connection.