ENEnglish
 LTLietuviškai
 DEDeutsch
 FRFrançais
 RUРусский
 ESEspañol
 PLPolski
 ITItaliano
 UKУкраїнська
 CSČeština
 PTPortuguês
 JA日本語
JA日本語 LVLatviešu valoda
 ETEesti
 HUMagyar
 IDBahasa Indonesia
 TRTürkçe
 HIहिन्दी
 ELΕλληνικά
 ARالعربية
 THไทย
THไทย VITiếng Việt
 RORomână
 MSBahasa Melayu
 BNবাংলা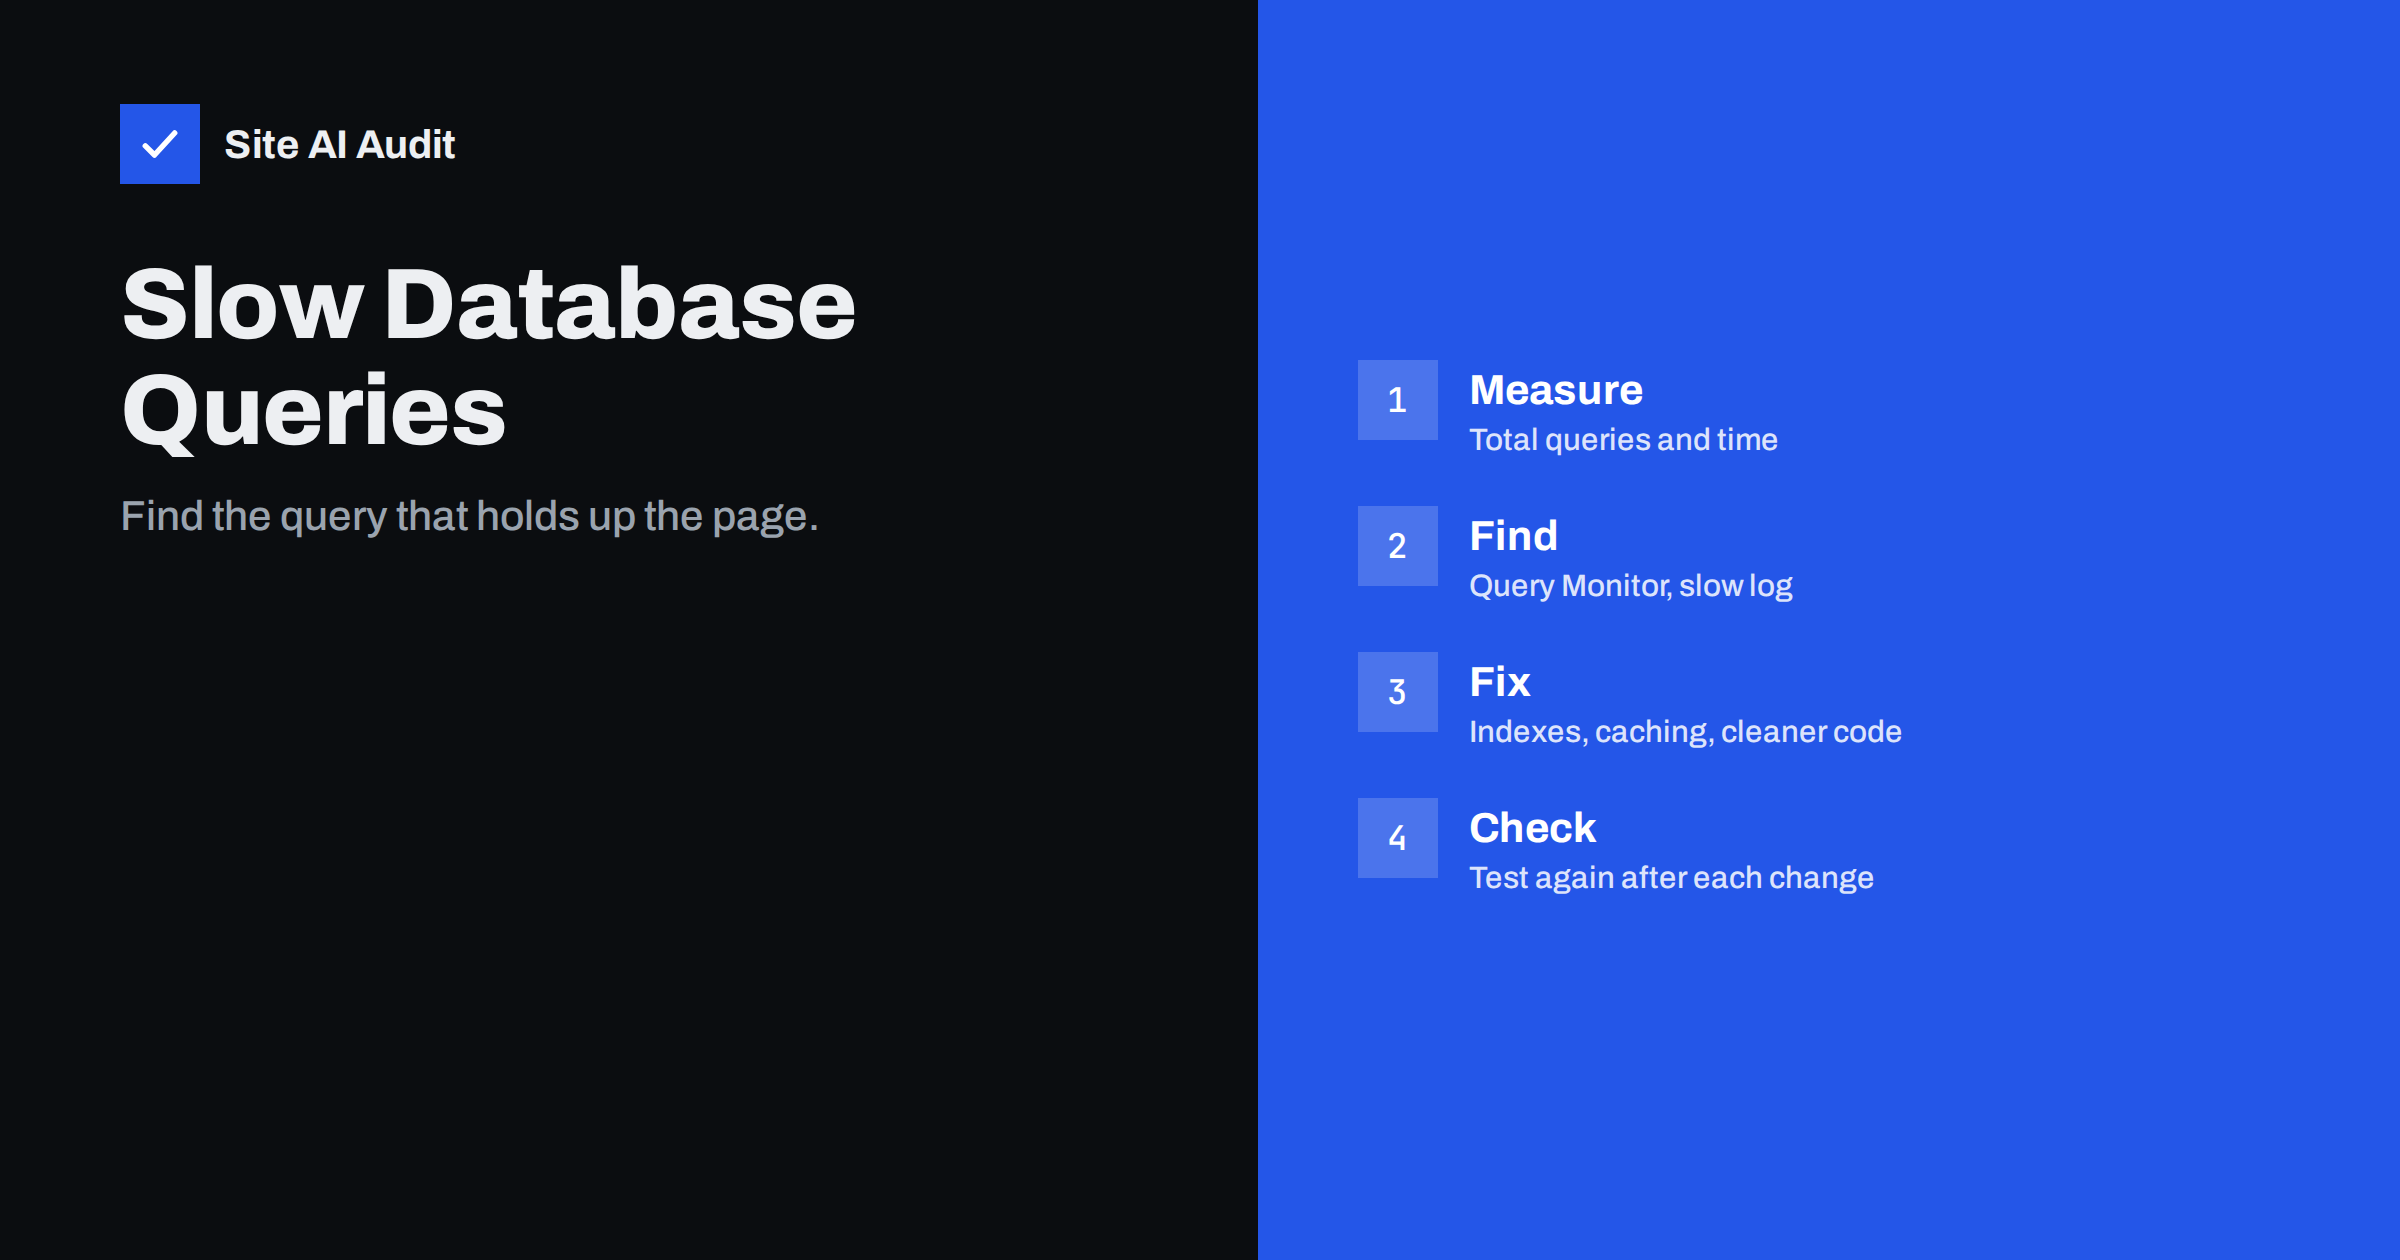
Short answer: A slow WordPress page is often waiting for the database. To find the cause, measure the number and duration of queries with a tool such as Query Monitor or the MySQL slow query log, identify which plugin, theme or function runs the slowest ones, then fix them with caching, better queries, indexes or by removing the source. Always back up the database before you change anything.
How the database slows a page
Every time WordPress builds a page that is not cached, it asks the database many questions: which options are set, which posts to show, which metadata belongs to them, which menu to display. A simple page can make dozens of queries, and a complex shop or membership page can make hundreds. Most are fast, taking a fraction of a millisecond.
The trouble starts with a few slow ones. A single query that scans a huge table can take a second or more, and the page cannot be sent until it finishes. That delay shows up as a high time to first byte, which we explain in our guide to reducing server response time. Page caching hides the problem for visitors, but not for the admin area, logged-in users, search, carts and any page that is not cached.
Signs of a database problem
- The admin dashboard and the post editor are slow, even when the public site is fast.
- Search, filters, shop archives or account pages take much longer than ordinary pages.
- The server response time is high for uncached pages.
- Your host reports high database usage or long-running queries.
- Speed gets worse as the site grows, with more posts, products, orders or comments.
These signs can also come from a slow plugin or an underpowered server. Measuring is the only way to know, and it is the first step in finding which plugin slows your site.
Find slow queries with Query Monitor
Query Monitor is a free plugin that adds a panel to the admin bar and shows what happened while the current page was built. It is best used on a staging copy, or briefly on the live site, and removed when you finish.
- Install and activate it, then load the page you want to study while logged in as an admin.
- Open the panel. The summary shows page generation time, memory and the number of database queries with their total time.
- Look at the queries by component. It groups queries by plugin, theme and core, so you can see which source costs the most.
- Sort by time. The slowest queries show the exact SQL and the function that called them.
- Look for duplicates. The same query repeated many times points to a loop that asks a question again for every item.
Treat the numbers as relative. A page with many fast queries may be fine, while one query of half a second is a real target.
Find slow queries with the slow query log
If you can reach the server settings, MySQL and MariaDB can write every query slower than a limit to a log file. You enable it with the slow_query_log option and set long_query_time to a value in seconds, for example one second. On shared hosting you may not have access, but some hosts provide a slow query report or a monitoring panel.
- Run it during busy hours to catch real traffic, not only your own tests.
- Group similar queries, because the same slow statement will repeat with different values.
- Look at both how long a query takes and how often it runs. A fast query run ten thousand times can cost more than one slow query.
- Turn the logging off when you are finished, or keep a conservative limit, as logs grow.
Common causes in WordPress
- Too much autoloaded data. The options table is read on every request, and a large autoloaded set slows everything. See autoloaded options and why they slow a site.
- Meta queries on large tables. Searching by custom field values in the postmeta table can be slow, because the value column is not indexed in a standard installation.
- Unbounded queries. A plugin or theme that asks for all posts instead of a page of them, or loads thousands of rows to show ten.
- Random ordering. Sorting by random on a big table forces the database to touch every row.
- Wildcard searches. A LIKE search with a leading wildcard cannot use an index.
- Repeated queries in loops. The classic pattern of asking one question per item, instead of one question for all items.
- Bloated tables. Old revisions, expired transients, orphaned metadata and logs left by plugins that were removed. Our guide to safe WordPress database cleanup covers this.
- Shop data. Large catalogues and order histories. Recent WooCommerce versions have an order storage system with dedicated tables, which is faster than storing orders as posts, but check what your store uses before you change it.
How to fix what you find
The right fix depends on the cause. Go from the simplest and safest to the more technical.
- Remove or replace the source. If one plugin is responsible for the slowest queries and you can live without it, deactivating it is the quickest fix. Look for a lighter alternative if you need the function.
- Add an object cache. A persistent cache such as Redis stores the results of repeated queries in memory. It is one of the most effective changes for dynamic sites, as explained in object caching with Redis.
- Clean the data. Remove expired transients, trim autoloaded options and delete orphaned data from uninstalled plugins, after a backup.
- Improve the query. A developer can limit the number of rows, avoid random ordering, ask for only the needed fields and replace loops with a single query.
- Add an index. If a query filters or sorts on a column without an index, a suitable index can change a query from seconds to milliseconds. Use the EXPLAIN statement to see how the query runs. Do this on a copy first, because indexes use space and slow down writes slightly.
- Upgrade the database server or the plan. A modern, well-tuned database with enough memory is often much faster than an old shared one. Moving to a better plan is reasonable once the software is already clean.
Change one thing at a time, and measure again after each. Otherwise you will not know which change worked, or which caused a new problem.
Keep the database healthy
- Limit post revisions and delete old ones on a schedule.
- Review plugins twice a year and remove those you do not use, then check for leftover tables.
- Back up before every cleanup and test restores, as described in our website backup strategy.
- Keep WordPress, plugins and PHP updated, since newer versions often contain query improvements.
- Re-test after big changes such as importing thousands of products or adding a membership plugin.
Finally, measure over time rather than once. Record the page generation time and the number of queries for a few key pages, such as the home page, a product or article page, search and the admin dashboard, and repeat the test monthly or after major updates. A trend shows quickly when a new plugin or a growing table has started to cost more than it should. Share the numbers with your host or developer when you ask for help, because “the site is slow” is hard to act on, while “the product archive makes 400 queries and one takes 800 milliseconds” is a clear starting point.
What Site AI Audit can and cannot tell you
Site AI Audit tests your website from the outside. It reports the Google PageSpeed score, Core Web Vitals such as LCP, CLS and INP, server response time, compression and page weight. It cannot see your database or list slow queries. If it shows a high server response time on uncached pages, that is a signal to look inside with the tools in this article. You can run a free check of your website or see the plans for repeated checks.
Related reading
- WordPress Autoloaded Options: The Hidden Cause of a Slow Site
- WordPress Database Cleanup: Safe Steps for Better Performance
- Object Caching with Redis: When Your Website Needs It
- How to Speed Up a Slow WooCommerce Store Without Breaking It
The bottom line
Slow queries are easy to overlook because they live behind the page. Measure them with Query Monitor or the slow query log, find the plugin or function behind the worst ones, and fix them with the safest option first: remove, cache, clean, improve, index. Take backups, change one thing at a time and test again.
GYIK
How many database queries per page is normal for WordPress?
There is no fixed limit. A simple blog page may use around 30 to 60, and a shop or builder page can use several hundred. Total time and the slowest queries matter more than the count itself.
Is Query Monitor safe to use on a live site?
It is widely used and shows data only to administrators, but it adds overhead. Use it briefly on a live site or, better, on a staging copy, and deactivate it when you have the information you need.
Will a caching plugin fix slow queries?
Page caching hides them for visitors who see cached pages, but the queries still run for the admin, carts, searches and cache misses. An object cache reduces repeated queries. Fixing the slow query is the lasting solution.
Should I optimise the database tables regularly?
Occasional optimisation after large deletions can help, but it is not a cure for slow queries. Focus on removing unneeded data and fixing the queries, and always take a backup before running maintenance commands.
When should I ask a developer for help?
Ask when the slowest queries come from custom code or from a plugin you cannot replace, or when indexes and server settings are involved. Give them the Query Monitor results or the slow log entries, so they can start with facts.