ENEnglish
 LTLietuviškai
 DEDeutsch
 FRFrançais
 RUРусский
 ESEspañol
 PLPolski
 ITItaliano
 UKУкраїнська
 CSČeština
 PTPortuguês
 JA日本語
JA日本語 LVLatviešu valoda
 ETEesti
 HUMagyar
 IDBahasa Indonesia
 TRTürkçe
 HIहिन्दी
 ELΕλληνικά
 ARالعربية
 THไทย
THไทย VITiếng Việt
 RORomână
 MSBahasa Melayu
 BNবাংলা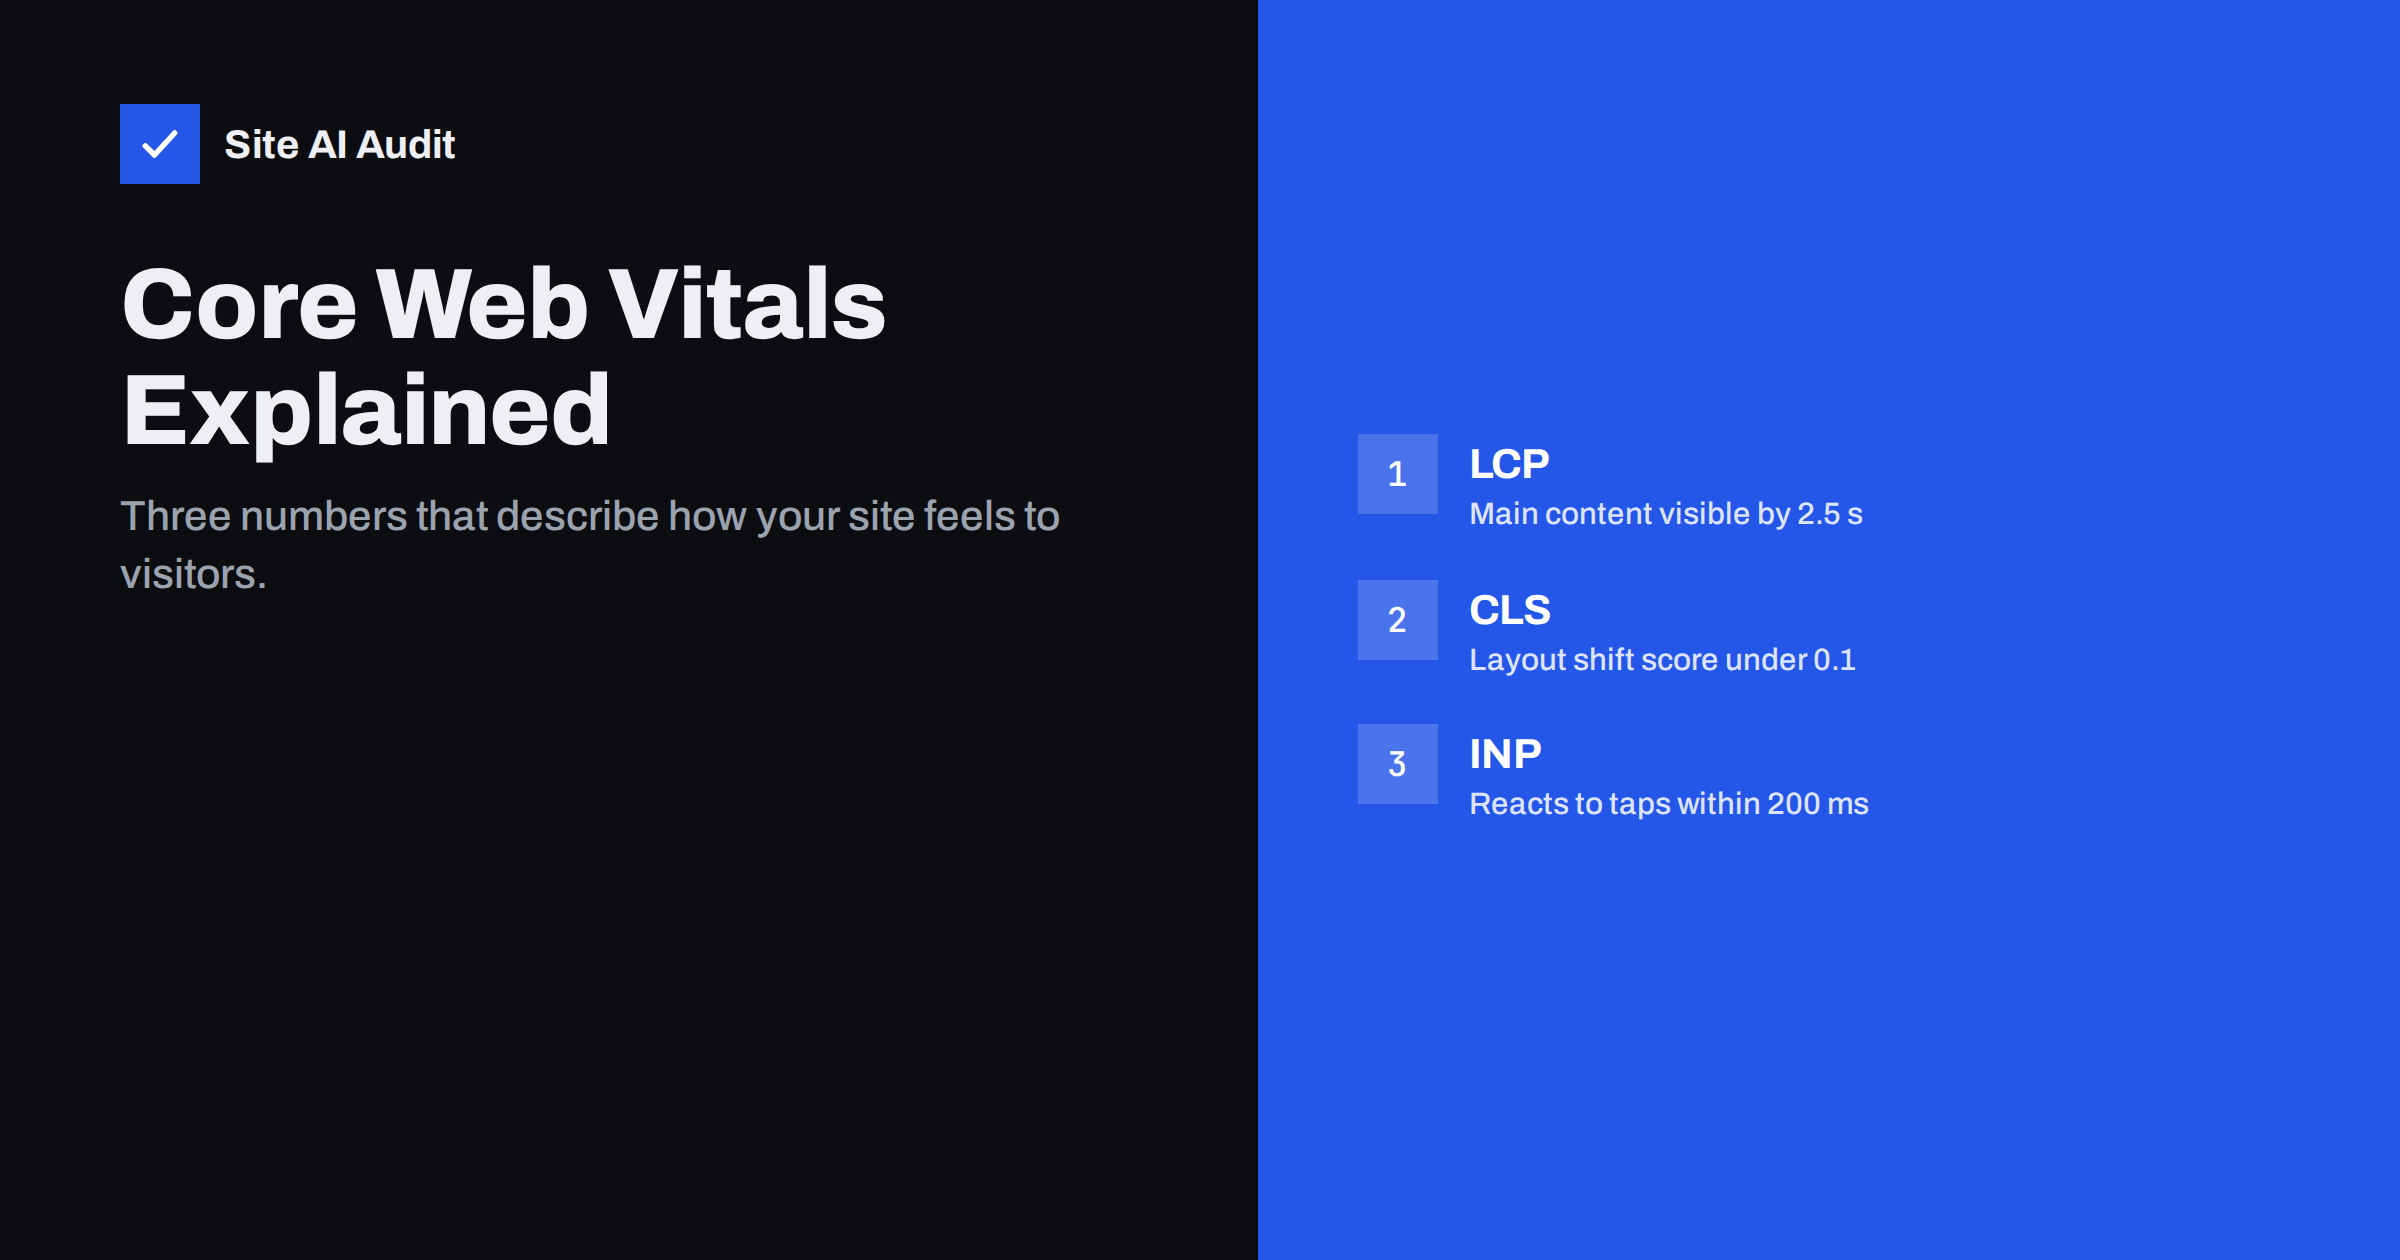
Short answer: Core Web Vitals are three metrics Google uses to describe real-user experience on a page: Largest Contentful Paint (LCP) for loading, Cumulative Layout Shift (CLS) for visual stability, and Interaction to Next Paint (INP) for responsiveness. A page passes when, for at least 75% of visits, LCP is 2.5 seconds or less, CLS is 0.1 or less and INP is 200 milliseconds or less.
If you have ever opened a speed report and seen three acronyms in red, this guide is for you. Core Web Vitals sound technical, but each one answers a simple question a visitor would ask: did the page show up quickly, did it stay still while I read it, and did it react when I tapped something? Once you know what each number means, it becomes much easier to decide what to fix and what to ignore.
What Core Web Vitals are and why Google created them
For years, website speed was described with dozens of different numbers: load time, page size, requests, scores from various tools. Many of them did not match what people actually experienced. Google introduced Core Web Vitals to focus on a small set of user-centred measurements that apply to every website.
Three things make them different from older speed metrics:
- They measure experience, not technology. They do not care which server or framework you use, only what the visitor sees and feels.
- They are measured on real visits. Chrome collects anonymised data from users who opted in, and Google publishes it in the Chrome User Experience Report (CrUX).
- They have clear thresholds. Each metric has a “good”, “needs improvement” and “poor” range, so you know when you are done.
Core Web Vitals are part of Google’s page experience signals. They are one of many factors in search, and relevance of content remains far more important, but a slow and jumpy site loses visitors regardless of rankings.
Largest Contentful Paint (LCP): does the page load quickly?
LCP measures how long it takes until the largest visible element in the viewport has rendered. On most pages that is a hero image, a large heading, a product photo or a video poster. It is a good proxy for the moment a visitor feels the page has “arrived”.
- Good: 2.5 seconds or less
- Needs improvement: 2.5 to 4 seconds
- Poor: more than 4 seconds
Typical causes of a slow LCP:
- Slow server response, so the browser waits before it can start anything.
- A large, uncompressed hero image, or one served in an old format.
- The LCP image is lazy-loaded or discovered late, for example as a CSS background.
- Render-blocking CSS and JavaScript that must load before anything is painted.
- Sliders that wait for a script before showing the first slide.
Cumulative Layout Shift (CLS): does the page stay still?
CLS measures how much visible content moves unexpectedly while the page is in use. You have seen it: you start reading, an image or banner loads above the text, and everything jumps down. Or you go to tap a button and an ad pushes it away at the last moment.
- Good: 0.1 or less
- Needs improvement: 0.1 to 0.25
- Poor: more than 0.25
CLS is a score, not a time. It combines how much of the screen moved and how far. Shifts that happen right after a user action, such as opening a menu, do not count.
Typical causes of layout shift:
- Images and videos without width and height attributes, so the browser cannot reserve space.
- Cookie banners, promo bars or newsletter boxes injected at the top of the page after load.
- Ads and embeds that change size when they load.
- Web fonts that swap in with different letter sizes, making text reflow.
Interaction to Next Paint (INP): does the page respond quickly?
INP measures how quickly the page visually responds after a user clicks, taps or presses a key. It looks at interactions throughout the whole visit and reports one of the slowest. INP replaced the older First Input Delay (FID) metric as a Core Web Vital in March 2024, because FID only looked at the first interaction and only at part of the delay.
- Good: 200 milliseconds or less
- Needs improvement: 200 to 500 milliseconds
- Poor: more than 500 milliseconds
Typical causes of poor INP:
- Heavy JavaScript that keeps the browser’s main thread busy.
- Third-party scripts such as chat widgets, tag managers, ad and tracking scripts.
- Event handlers that do a lot of work before updating the screen, for example filtering a large product list.
- Very large pages with thousands of elements that are slow to update.
INP problems show up most on mid-range and older phones, which have much less processing power than a developer’s laptop.
Field data vs lab data: why your numbers disagree
Speed tools report two different kinds of data, and mixing them up causes a lot of confusion.
| Field data | Lab data | |
|---|---|---|
| Source | Real Chrome users over the last 28 days | One simulated load in a test environment |
| Metrics | LCP, CLS, INP and others | LCP, CLS, Total Blocking Time, performance score |
| Used for Core Web Vitals assessment | Yes | No |
| Changes after a fix | Gradually, over weeks | Immediately |
| Best for | Knowing where you really stand | Diagnosing causes and testing fixes |
Lab tests cannot measure INP because nobody clicks anything during the test. They use Total Blocking Time (TBT) as a stand-in: high TBT in the lab usually predicts poor INP in the field.
Small sites often have no field data at all, because there are not enough Chrome visits to publish statistics. In that case the lab data is the best guide you have, and you should read it with its limits in mind.
How to check your Core Web Vitals
- PageSpeed Insights. Enter a URL and see field data for that page and the whole origin at the top, and a Lighthouse lab test below. Check the mobile tab first.
- Google Search Console. The Core Web Vitals report groups your URLs into good, needs improvement and poor, based on field data, and shows which groups share a problem.
- Chrome DevTools. The Performance panel shows live LCP, CLS and INP values as you use the page, which is useful for finding the exact element or interaction at fault.
- A website audit. An audit tool that checks many pages at once shows whether a problem is limited to one template or affects the whole site.
Google’s own documentation on web.dev describes each metric and its thresholds in detail if you want to go deeper.
Which fixes help small business sites the most
You do not need a developer team to improve Core Web Vitals. On typical small-business websites, a short list of changes covers most of the problems:
- Compress and resize the hero image, serve it as WebP or AVIF, and do not lazy-load it.
- Enable page caching and compression so the server answers quickly.
- Add width and height to every image and reserve space for banners and embeds.
- Remove unused scripts and delay chat widgets and similar tools until they are needed.
- Limit web fonts to a few weights and use a sensible
font-displaysetting.
Work on one metric at a time and start with the one that is furthest in the red. If LCP is poor, look at the server and the main image before anything else. If CLS is poor, open the page on a phone with a slow connection and watch what moves. If INP is poor, list every script on the page and ask whether each one earns its place. After each change, run a lab test to confirm the improvement, then give the field data a few weeks to catch up.
How Site AI Audit helps
Site AI Audit runs Google PageSpeed for mobile as part of every check and reports LCP, CLS and INP next to server response time, compression and page weight. Each finding says what is wrong, why it matters and how to fix it, ranked by impact together with SEO, SSL and e-mail findings. You can check your website for free and see which of the three metrics needs attention first.
Related reading
- Landing Page Speed for Paid Ads: Stop Paying for Lost Clicks
- Why Your Website Is Slow on Mobile and How to Fix It
- First Contentful Paint (FCP): What It Is and How to Improve It
The bottom line
Core Web Vitals boil down to three questions: does the page appear fast (LCP), does it stay still (CLS), and does it react quickly (INP)? Look at field data to know where you stand, use lab data to find causes, and fix the biggest issue first. For most small sites that means images, caching and scripts.
KKK
Are Core Web Vitals a ranking factor?
Yes, they are part of Google’s page experience signals, but they are one factor among many. Relevant, helpful content matters far more. Good Core Web Vitals will not make a weak page rank, but poor ones can hurt user experience and conversions.
Why does PageSpeed Insights say “no data” for my site?
Field data only appears when enough Chrome users have visited a page or the whole site in the last 28 days. Many small sites do not reach that threshold. Use the lab results in the same report as your guide until field data becomes available.
How long does it take for fixes to show in Core Web Vitals?
Field data covers a rolling 28-day window, so improvements appear gradually over about four weeks. Lab tests show the effect immediately. Check the lab result right after a fix and the field data a month later.
What replaced First Input Delay?
Interaction to Next Paint (INP) replaced First Input Delay as a Core Web Vital in March 2024. INP looks at the responsiveness of interactions during the whole visit, not only the first one. Pages with heavy JavaScript often score worse on INP than they did on FID.
Do Core Web Vitals differ on mobile and desktop?
Yes. Google reports them separately, and mobile values are usually worse because phones have slower processors and networks. Most small-business sites get the majority of visits from phones, so fix mobile first.