ENEnglish
 LTLietuviškai
 DEDeutsch
 FRFrançais
 RUРусский
 ESEspañol
 PLPolski
 ITItaliano
 UKУкраїнська
 CSČeština
 PTPortuguês
 JA日本語
JA日本語 LVLatviešu valoda
 ETEesti
 HUMagyar
 IDBahasa Indonesia
 TRTürkçe
 HIहिन्दी
 ELΕλληνικά
 ARالعربية
 THไทย
THไทย VITiếng Việt
 RORomână
 MSBahasa Melayu
 BNবাংলা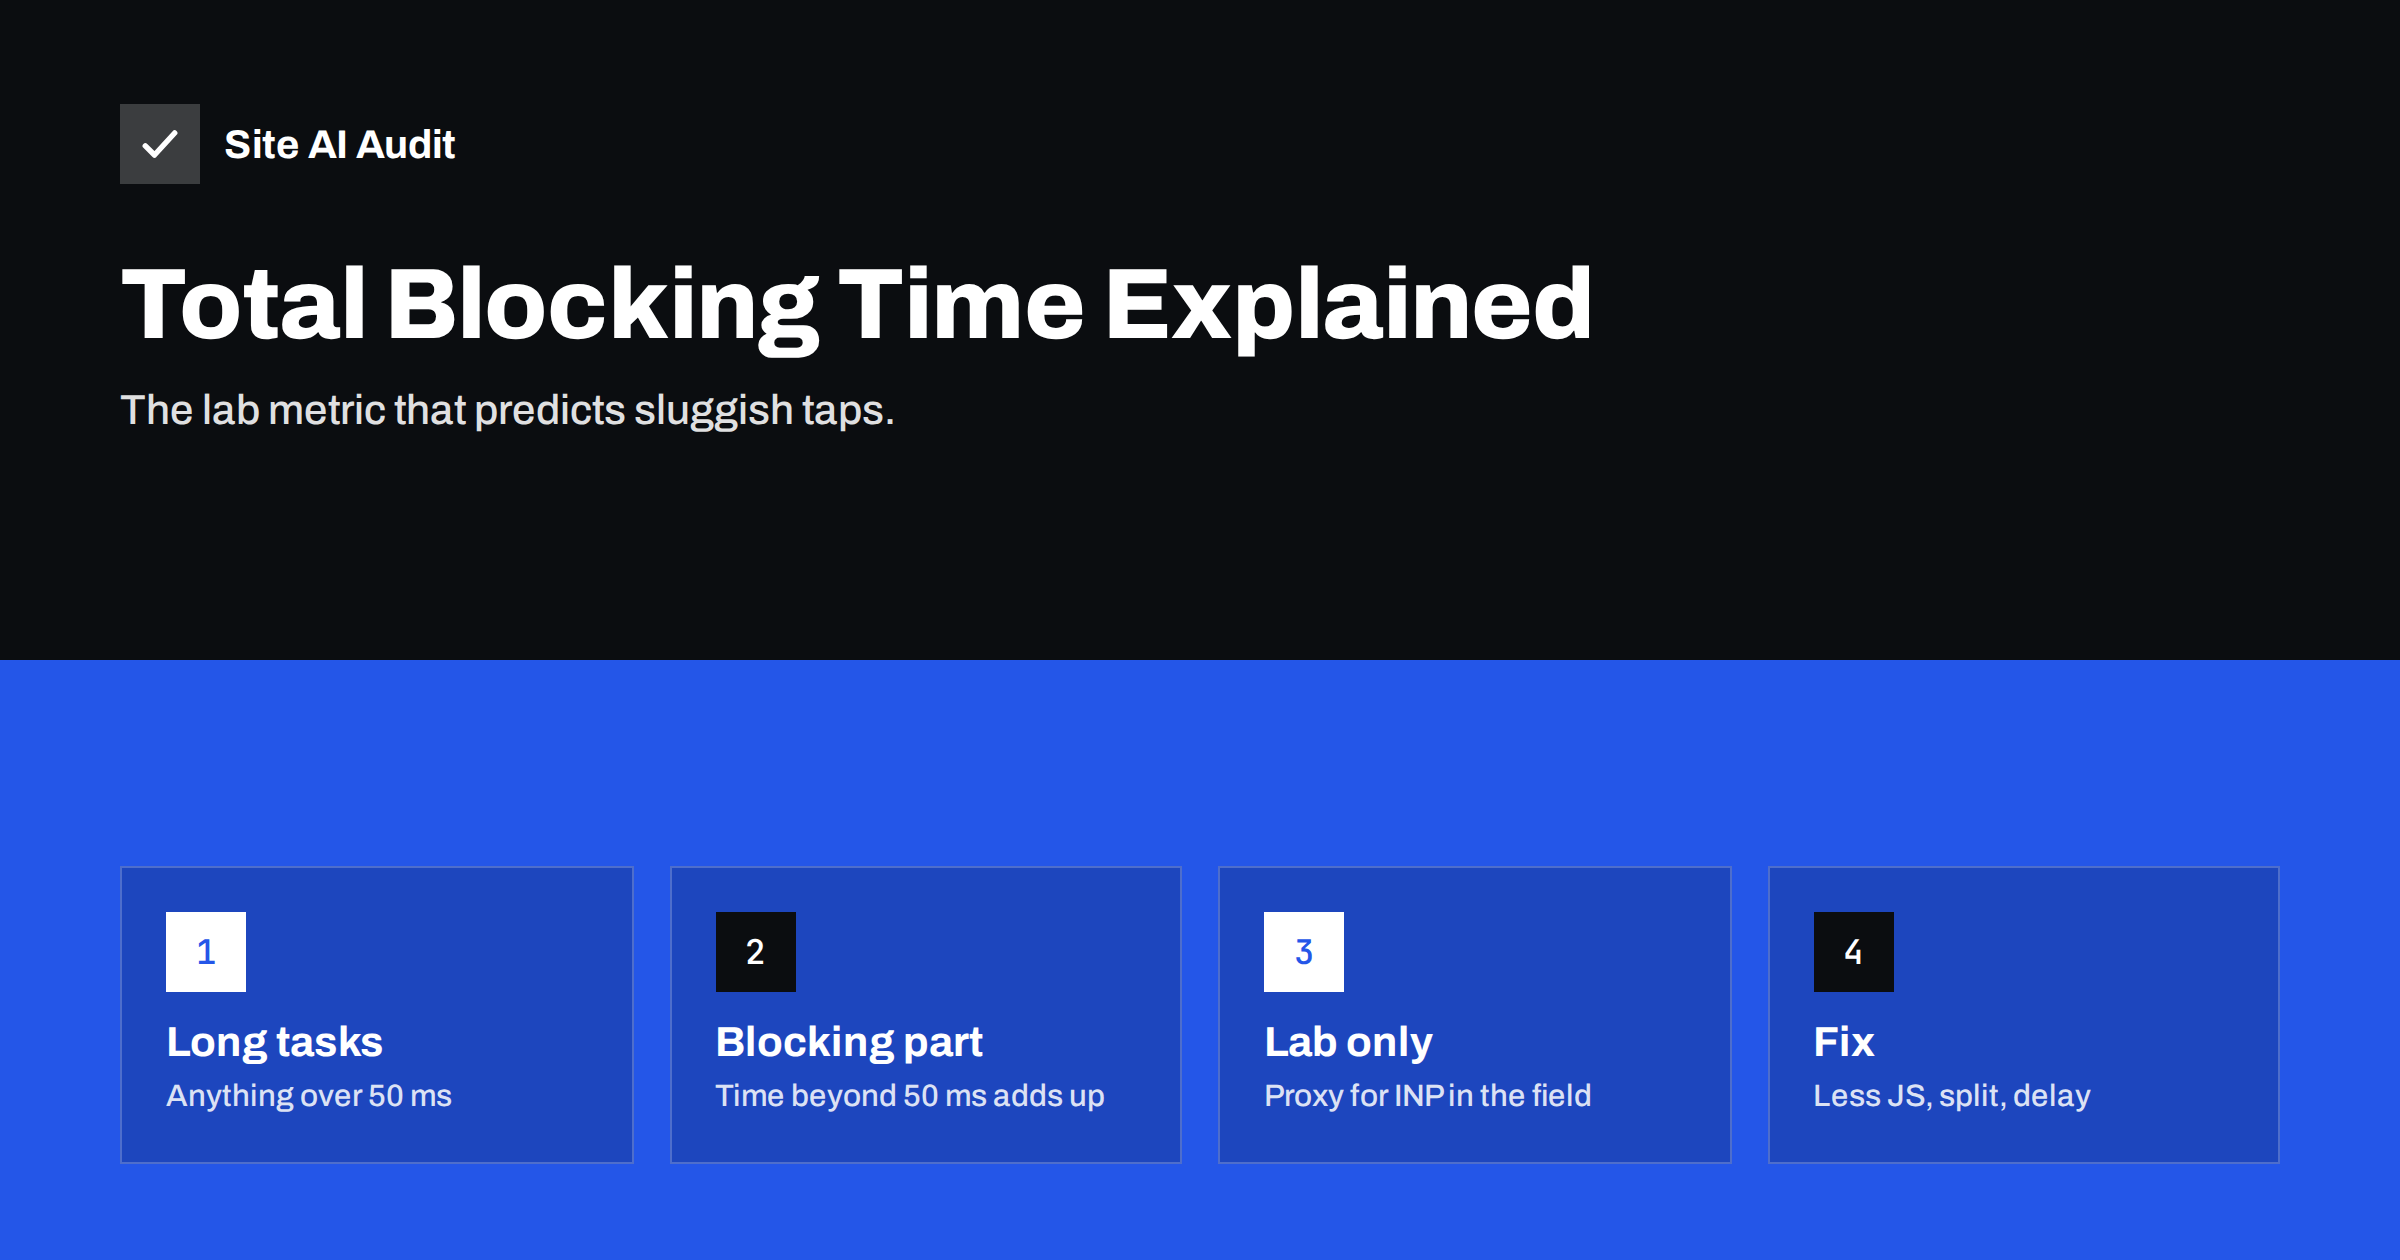
Short answer: Total Blocking Time (TBT) is a lab metric that adds up how long the browser’s main thread was blocked by long tasks between First Contentful Paint and the point where the page becomes reliably interactive. Any task longer than 50 milliseconds counts, and only the part beyond 50 milliseconds is added. Lighthouse treats a mobile TBT of 200 milliseconds or less as good. TBT is not a Core Web Vital, but it carries a large weight in the Lighthouse performance score and is the best lab predictor of Interaction to Next Paint. Reduce it by shipping less JavaScript, splitting long tasks and delaying non-essential scripts.
If you have ever wondered why your PageSpeed Insights score is low even though the page appears quickly, Total Blocking Time is often the answer. It measures something visitors feel but rarely describe precisely: the page looks ready, but the first tap does nothing for a moment, or scrolling stutters. Understanding TBT helps you connect a lab number to a real experience and find the scripts responsible.
The main thread and long tasks
Browsers do most of their work for a page on a single main thread: parsing HTML, running JavaScript, calculating styles and layout, and handling user input. While the main thread is busy with a task, it cannot respond to a click or tap until that task finishes.
A long task is any piece of work that occupies the main thread for more than 50 milliseconds. The threshold comes from the idea that to respond to input within about 100 milliseconds, which feels immediate, the browser must never be stuck on one task for too long. Parsing and executing a large JavaScript bundle, initialising a slider, running a tag manager or rendering a big chunk of HTML can all create long tasks.
How TBT is calculated
For each long task between First Contentful Paint and Time to Interactive in a lab test, Lighthouse takes the portion above 50 milliseconds and adds it up:
| Task length | Blocking portion |
|---|---|
| 40 ms | 0 ms (not a long task) |
| 70 ms | 20 ms |
| 150 ms | 100 ms |
| 400 ms | 350 ms |
| Total Blocking Time | 470 ms |
This means one enormous task hurts more than many small ones of the same total length. Splitting work into chunks below 50 milliseconds removes it from TBT entirely, even if the total work stays the same, because the browser can handle input in between.
What counts as good
Lighthouse scores TBT against thresholds based on real-world data. On mobile, 200 milliseconds or less is considered good, and values above 600 milliseconds are poor. Remember that the mobile lab test simulates a slower CPU, so the same page can have a much higher TBT on mobile than on desktop.
TBT, INP and the performance score
- TBT is a lab metric. It is measured in a simulated load without real users.
- INP is a field metric and a Core Web Vital. It measures how quickly the page responds to real interactions throughout a visit.
- They are related. Pages with high TBT usually have busy main threads, which makes real interactions slow, especially early in the visit. TBT is therefore the recommended lab proxy for INP.
- TBT weighs heavily in the Lighthouse score. In current Lighthouse versions it carries the largest weight of all metrics, which is why heavy JavaScript drags the score down even when LCP is fine.
Because TBT only covers the loading period, a page can have low TBT and still poor INP if interactions later in the visit trigger heavy work, for example filtering a large list. Test interactions directly in DevTools as well.
What causes high TBT
- Large JavaScript bundles that must be parsed, compiled and executed at load.
- Third-party scripts: tag managers with many tags, analytics, advertising, chat, A/B testing and social widgets.
- Theme and page builder scripts initialising animations, sliders, sticky headers and effects.
- Client-side rendering, where frameworks build the page in the browser.
- Hydration in modern frameworks, which attaches interactivity to server-rendered HTML in one large step.
- Large DOM updates and layout work triggered by scripts.
- Optimisation plugins that delay all scripts until the first interaction, then run everything at once.
How to find the long tasks
- In PageSpeed Insights, look at the diagnostics for main-thread work, JavaScript execution time and third-party usage. These show which scripts consume the most time.
- Open Chrome DevTools, go to the Performance panel, set CPU throttling to 4x or 6x, and record a page load.
- Long tasks are marked with a red corner in the main-thread track. Click one to see the call tree and which script file it belongs to.
- Use the Bottom-Up tab grouped by domain or URL to see total time per script source.
- Block individual third-party domains in the Network panel and re-test to measure their contribution.
How to reduce TBT
- Remove scripts you do not need. Old tags, unused plugins, duplicate analytics. This removes blocking time entirely.
- Load scripts only where needed. Form, map and gallery scripts belong only on pages that use them.
- Delay non-essential third parties such as chat widgets until after the page has loaded, being careful not to pile everything onto the first interaction.
- Split long tasks in your own code by yielding to the main thread between chunks of work.
- Code-split bundles so each page loads only what it needs, and load features on demand.
- Replace heavy components such as JavaScript sliders and animation libraries with CSS or simpler alternatives.
- Move heavy computation to a Web Worker where it does not need access to the page.
- Prefer server-side rendering for content, and hydrate interactive parts selectively.
An example of reading TBT
Suppose a service company’s home page shows a mobile TBT well above the good threshold, while LCP is acceptable. The Performance panel recording reveals four long tasks during loading. The largest comes from the tag manager, which fires several advertising and analytics tags at once. The second is the theme’s main script initialising a slider and entrance animations. The third belongs to a chat widget, and the fourth to a review carousel near the footer. None of these is needed to read the page or tap the main button. The team removes two retired advertising tags, replaces the slider with a static hero, loads the chat widget a few seconds after the page settles and lazy-loads the review carousel when it scrolls into view. The next lab test shows TBT in the good range, and over the following weeks the field INP improves as well. Apart from the hero, which now shows one clear message instead of rotating slides, the page looks the same to visitors, but it responds to them sooner. The same method works on any site: record, identify each long task by its source, and ask whether that work needs to happen during loading at all.
A note on “delay JavaScript” features
Many optimisation plugins offer to delay all JavaScript until the first user interaction. This can make TBT in lab tests look excellent, because the test never interacts, so the scripts never run. Real visitors, however, pay the full cost on their first tap or scroll, when everything executes at once, which can make INP worse. Use such features selectively, exclude scripts needed for immediate interactions, and check real-user INP in the field rather than trusting a better lab score alone.
How Site AI Audit helps
Site AI Audit runs Google PageSpeed for mobile during every check, so heavy main-thread work shows up in the speed findings together with INP, LCP, page weight and server response time. Each finding explains the likely cause in plain words and what to change first, ranked by impact across your SEO, security and e-mail checks. Run a free check to see where your pages stand.
Related reading
- Interaction to Next Paint (INP): How to Fix Slow Interactions
- How to Reduce Unused JavaScript and Speed Up Your Pages
- How Third-Party Scripts Slow Down Your Website (and Fixes)
- How to Read a PageSpeed Insights Report Without Guesswork
The bottom line
Total Blocking Time adds up the parts of long tasks beyond 50 milliseconds during page load. It is a lab metric, but it predicts how responsive your page feels and dominates the Lighthouse score. Find the long tasks in DevTools, remove or delay scripts you do not need, split what remains into smaller pieces, and confirm improvements with real-user INP.
FAQ
What is a good Total Blocking Time?
Lighthouse considers a TBT of 200 milliseconds or less on mobile as good. Values above 600 milliseconds are considered poor. Desktop values are usually much lower because the simulated CPU is faster.
Is Total Blocking Time a Core Web Vital?
No. TBT is a lab metric used in Lighthouse. The related Core Web Vital is Interaction to Next Paint, measured on real users. TBT is the recommended lab proxy for INP.
Why is my TBT high when my page loads fast?
The page may paint quickly but still run a lot of JavaScript afterwards, keeping the main thread busy. Visitors see content but interactions feel sluggish. Check the long tasks in the Performance panel to see which scripts are responsible.
Do third-party scripts affect TBT?
Yes, often significantly. Analytics, tag managers, ads, chat widgets and social embeds all run on the main thread. Lighthouse’s third-party summary shows how much blocking time each provider adds.
Does delaying JavaScript fix TBT?
It can lower TBT in lab tests, because delayed scripts do not run during the test. Real visitors may then experience a slow first interaction when all scripts execute together. Delay selectively and check field INP.