ENEnglish
 LTLietuviškai
 DEDeutsch
 FRFrançais
 RUРусский
 ESEspañol
 PLPolski
 ITItaliano
 UKУкраїнська
 CSČeština
 PTPortuguês
 JA日本語
JA日本語 LVLatviešu valoda
 ETEesti
 HUMagyar
 IDBahasa Indonesia
 TRTürkçe
 HIहिन्दी
 ELΕλληνικά
 ARالعربية
 THไทย
THไทย VITiếng Việt
 RORomână
 MSBahasa Melayu
 BNবাংলা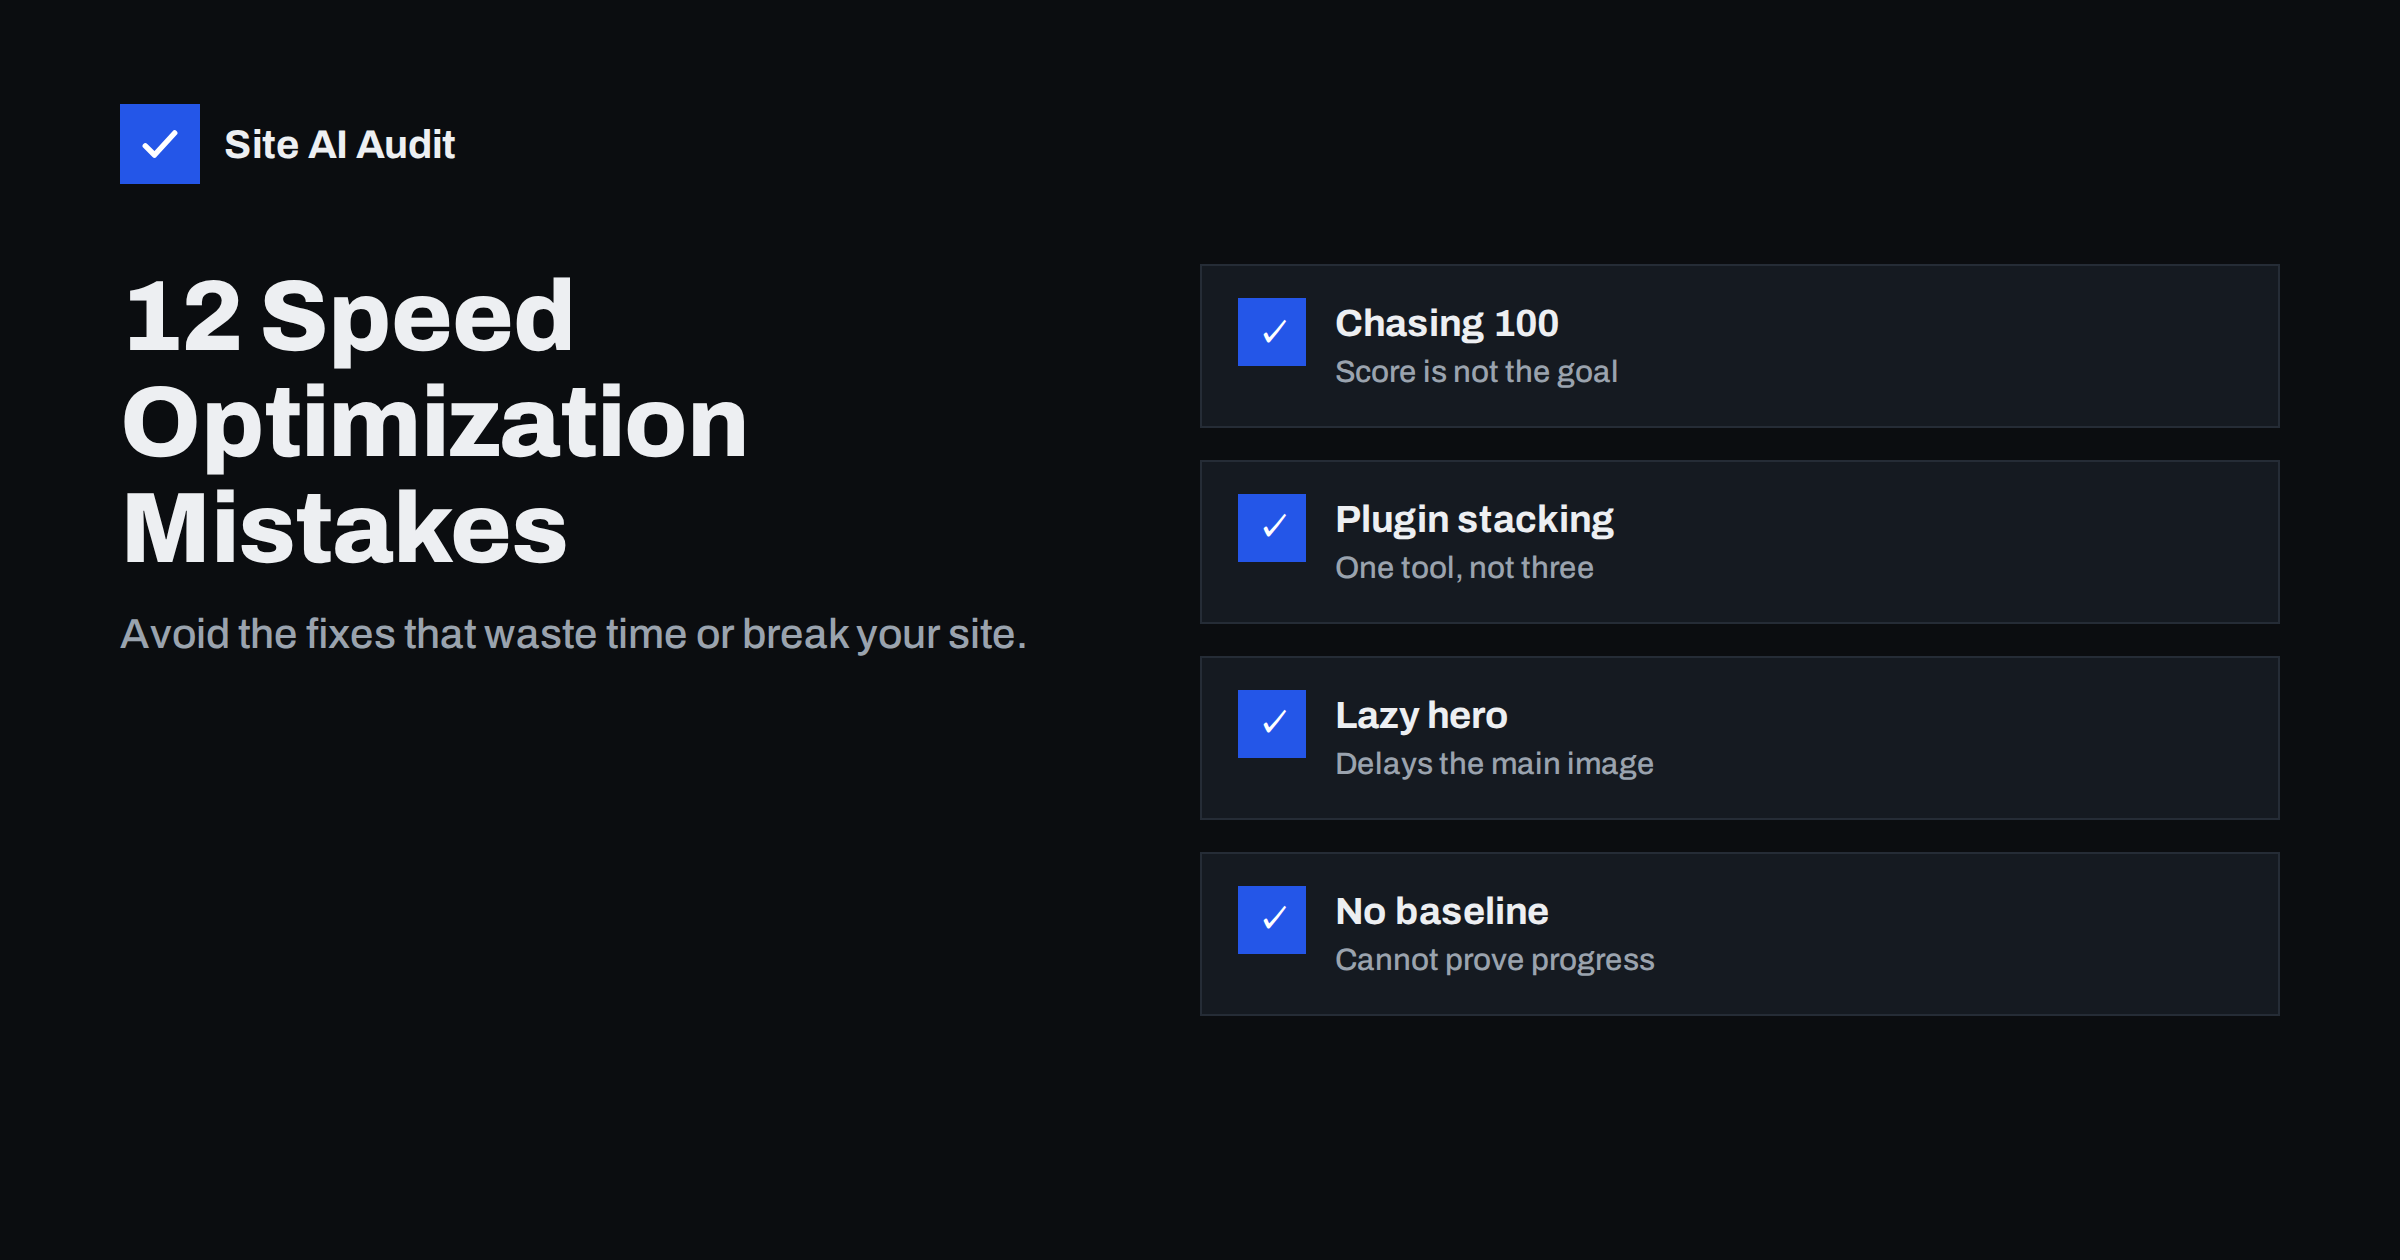
Short answer: The most common website speed mistakes are chasing a perfect lab score instead of real-user metrics, testing only on desktop, installing several overlapping optimisation plugins, lazy-loading the main image, buying bigger hosting before measuring, optimising small files while ignoring heavy images and third-party scripts, and changing many things at once without a baseline. Measure on mobile, fix the biggest bottleneck first, change one thing at a time and verify with field data.
Speed optimisation has a reputation for being technical and frustrating. Much of that frustration comes not from difficult problems but from common mistakes: effort spent where it cannot help, changes that undo each other, and fixes that break something else. Here are twelve mistakes seen again and again on small-business, agency and shop websites, with what to do instead.
1. Chasing a perfect PageSpeed score
The Lighthouse score is a lab summary that varies between runs and is not used by Google Search. Pushing from 90 to 100 often means removing useful features for no visible benefit. Instead: aim to pass Core Web Vitals in field data on mobile, and treat the lab score as a diagnostic, not a goal.
2. Testing only on desktop
A site can feel instant on a fast laptop and sluggish on a mid-range phone over mobile data, where most small-business visitors are. Instead: test in PageSpeed Insights’ mobile mode, use CPU and network throttling in DevTools, and try the site on an ordinary phone.
3. No baseline before changes
Without measurements before you start, you cannot tell which change helped, which hurt and which did nothing. Instead: record field data, LCP, CLS, TBT, page weight and server response for a few key pages first. Re-test after each change with the same settings.
4. Changing many things at once
Turning on every option in an optimisation plugin at the same time is a classic way to break a site and not know why. Instead: change one thing, clear caches, test functionality and speed, then move to the next. It feels slower but is much faster overall.
5. Stacking optimisation plugins
Two caching plugins, a separate minification plugin, an image plugin that also lazy-loads, a CDN that also minifies: each layer rewrites the page, and they conflict. Typical results are broken layouts, double lazy loading, stale caches and scripts that no longer run. Instead: use one tool per job, and check what your host and CDN already do before adding plugins.
6. Lazy-loading the main image
Lazy loading everything, including the hero image at the top, delays Largest Contentful Paint. It is one of the most frequent causes of a poor LCP on otherwise optimised sites. Instead: load the main image eagerly with fetchpriority="high", and lazy-load only images below the fold.
7. Upgrading hosting before measuring
A faster server only improves the server’s part of the load. If Time to First Byte is already fast, a new host will barely change LCP, INP or CLS. Instead: check server response for cached and uncached pages first. Upgrade when the server is actually slow or overloaded.
8. Optimising small things, ignoring big ones
Hours spent minifying a small stylesheet while a multi-megabyte hero image, a background video or eight marketing tags remain untouched. Instead: sort by impact. Look at the largest files and the longest tasks first; estimated savings in PageSpeed Insights help prioritise.
9. Forgetting third-party scripts
Site owners optimise their own code but leave chat widgets, tag managers, heatmaps, review widgets and social embeds untouched, although these often dominate main-thread time. Instead: list every third-party script, remove the unused ones, and delay or restrict the rest.
10. Breaking functionality for a better score
Deferring or delaying scripts can break menus, forms, cookie consent, tracking or checkout. Sometimes it goes unnoticed for weeks, while enquiries quietly drop. Instead: after every change, test the key journeys: mobile menu, contact form, search, add to cart, checkout and consent choices.
11. Ignoring layout shift and responsiveness
Speed work often focuses on load time alone. But a page that loads quickly and then jumps around, or does not respond to taps, still frustrates visitors and fails Core Web Vitals. Instead: give images and embeds dimensions, show banners as overlays, and reduce JavaScript to keep interactions responsive.
12. Treating speed as a one-time project
A site optimised once gradually slows down as plugins, tags and content are added. Months later, the gains have disappeared. Instead: monitor key pages regularly, test after every significant change, keep a change log and review plugins and tags twice a year.
Mistakes and better approaches at a glance
| Mistake | Better approach |
|---|---|
| Chasing a 100 score | Pass Core Web Vitals in field data |
| Desktop-only testing | Test mobile with throttling |
| No baseline | Record metrics before changing anything |
| Many changes at once | One change, test, repeat |
| Overlapping plugins | One tool per job |
| Lazy-loaded hero | Eager load with high priority |
| Hosting upgrade first | Measure server response first |
| Small wins first | Largest savings first |
| Ignoring third parties | Audit and trim tags |
| Untested changes | Test key user journeys |
| Load time only | Also CLS and INP |
| One-off project | Ongoing monitoring |
A simple order of work that avoids most mistakes
- Measure key pages on mobile and write down the numbers.
- Check server response and page caching.
- Fix the main image: size, format, priority.
- Remove unused plugins and third-party tags; restrict the rest to where they are needed.
- Defer non-critical scripts and remove unused CSS where easy.
- Set image dimensions and fix layout shifts.
- Re-measure, test key journeys, then monitor.
This order works because each step addresses a larger bottleneck than the next, and because each change is small enough to test on its own. It also produces a clear record of what helped, which is useful when you report results to a manager or client or need to explain a decision later.
A bonus mistake: fixing the wrong page
Many speed projects start and end with the home page, because it is the page owners look at most. Yet visitors from search and ads often land on service pages, blog posts or product pages, and buyers spend their most important minutes in the cart and checkout. Those pages may use different templates, load different plugins and have completely different bottlenecks. Check your analytics for the most visited landing pages and the pages in your conversion path, and include them in every measurement. A fast home page with slow product pages is not a fast website. Pick four or five representative pages, one per template, and treat them as your standard test set from now on, so every future measurement covers the pages that matter to your business, not only the one you see most often.
Why these mistakes are so common
Most of them come from the same root: speed tools present long lists of recommendations with equal visual weight, and optimisation plugins present long lists of switches. It is natural to work down the list or turn on every switch. But speed is dominated by a few large factors on any given page: the server, the main image, the heaviest scripts. Once those are right, the remaining items matter much less. Another cause is that the people who add weight to a site (editors, marketers, plugin updates) are rarely the people who measure speed, so the connection between a change and a slowdown is lost. Shared measurements and a change log fix that.
How Site AI Audit helps
Site AI Audit avoids several of these mistakes by design: it tests speed with Google PageSpeed in mobile mode, reports Core Web Vitals together with server response time, compression and page weight, and ranks every finding by impact, so the biggest problems come first. It also covers SEO, SSL, security headers and e-mail authentication in the same report. Paid plans add re-checks after each change and weekly monitoring; see the plans.
Related reading
- Website Speed Checklist: 30 Checks Before and After Launch
- How to Read a PageSpeed Insights Report Without Guesswork
- Lazy Loading Images: When It Helps and When It Hurts
- Website Speed Monitoring: Catch Slowdowns Before Customers Do
The bottom line
Most speed projects fail not because the problems are hard, but because effort goes to the wrong places or changes collide. Measure on mobile, work from the biggest bottleneck down, change one thing at a time, test what matters to customers and keep monitoring afterwards. That approach gets better results with less risk than any plugin setting.
الأسئلة الشائعة
What is the biggest mistake in website speed optimisation?
Working without measurements: changing things without a baseline, on desktop only, or chasing the lab score instead of real-user Core Web Vitals. Measuring first shows where the real bottleneck is and whether changes help.
Can speed optimisation break my website?
Yes, especially aggressive script deferral, combining files and running several optimisation plugins at once. Change one setting at a time and test menus, forms and checkout after each change.
Should I use multiple caching plugins?
No. Multiple page caching or optimisation layers conflict and cause stale content and broken pages. Use one caching solution, and check whether your host already provides one.
Why did my site get slower after optimising it?
Common causes include lazy-loading the hero image, preloading too many files, delaying all scripts until interaction, or conflicting plugins. Undo changes one by one and re-test to find the culprit.
How long does website speed optimisation take?
Basic improvements such as caching, image optimisation and removing unused scripts can often be done in a day or two for a small site. Field data then takes about four weeks to reflect the changes. Ongoing monitoring keeps the gains.