ENEnglish
 LTLietuviškai
 DEDeutsch
 FRFrançais
 RUРусский
 ESEspañol
 PLPolski
 ITItaliano
 UKУкраїнська
 CSČeština
 PTPortuguês
 JA日本語
JA日本語 LVLatviešu valoda
 ETEesti
 HUMagyar
 IDBahasa Indonesia
 TRTürkçe
 HIहिन्दी
 ELΕλληνικά
 ARالعربية
 THไทย
THไทย VITiếng Việt
 RORomână
 MSBahasa Melayu
 BNবাংলা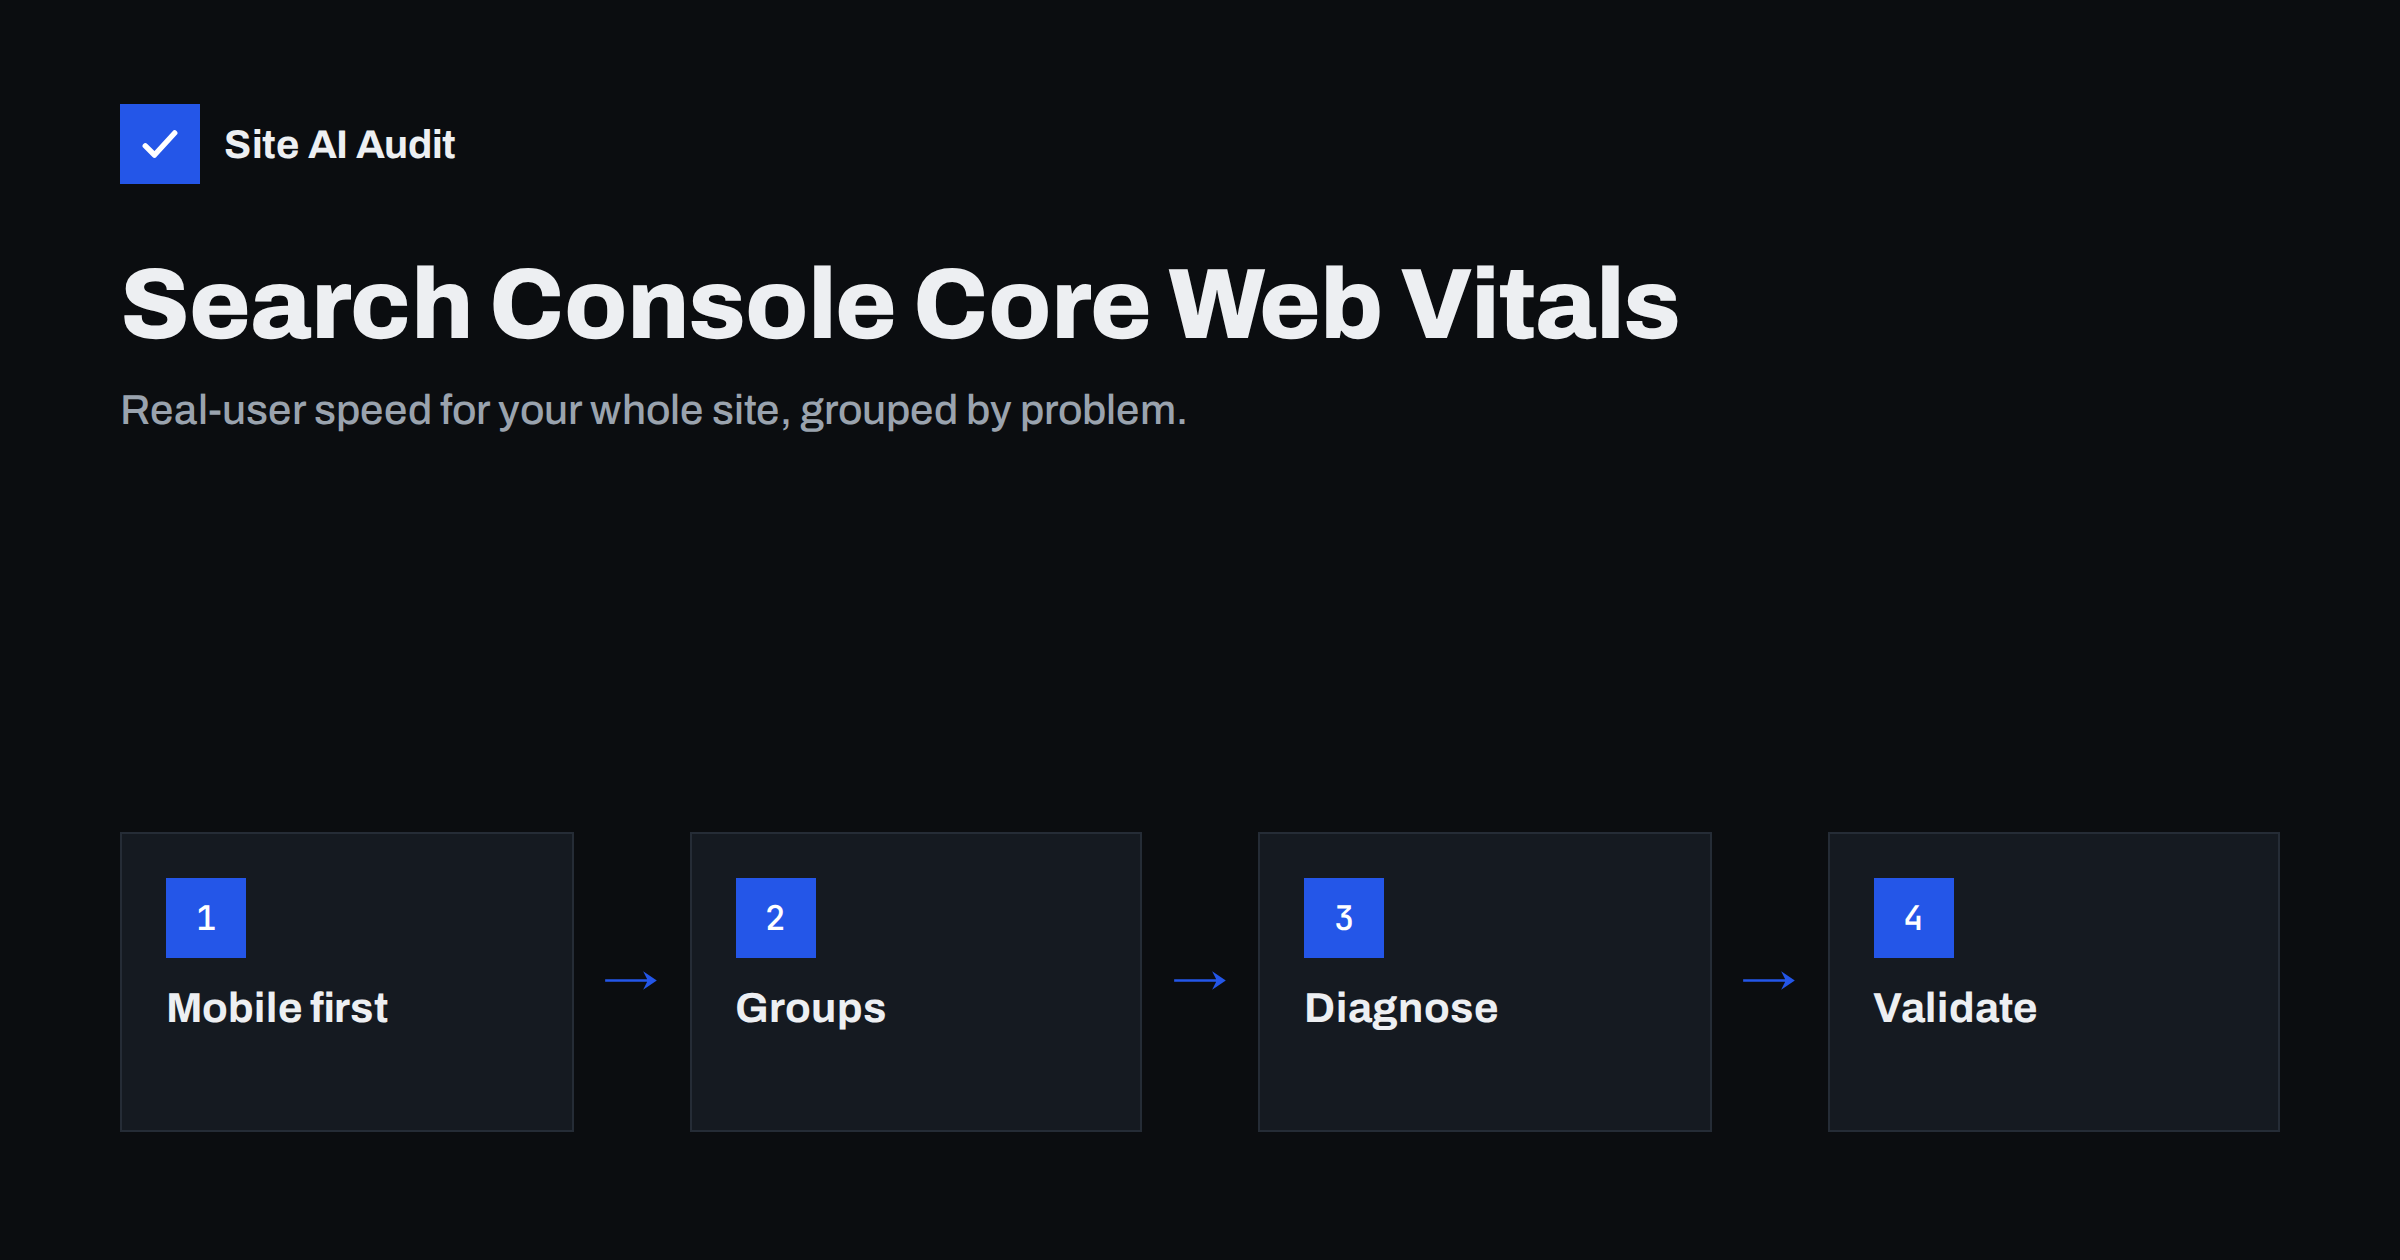
Short answer: The Core Web Vitals report in Google Search Console shows how real Chrome users experience your site’s pages, split into mobile and desktop, and classifies URLs as good, needs improvement or poor based on LCP, INP and CLS. URLs are grouped by similar pages, so one issue usually points to a template. To use it, open the mobile report, click the failing issue, inspect an example URL with PageSpeed Insights to find the cause, fix the template, and click “Validate fix” to have Google monitor the group over the following 28 days.
PageSpeed Insights shows one page at a time. The Core Web Vitals report in Search Console shows your whole site, based on the same real-user data Google uses for its page experience signals. It is the best place to see whether speed problems are isolated or widespread, which templates are affected, and whether your fixes have actually reached visitors. It is also free and requires nothing more than a verified Search Console property.
Where to find it and what it shows
In Search Console, open “Core Web Vitals” under the Experience section. You will see two charts, one for mobile and one for desktop. Each shows the number of URLs in three categories over time:
- Good: the URL group meets the thresholds for all three metrics.
- Needs improvement: at least one metric is in the middle range, none is poor.
- Poor: at least one metric is poor.
The status of a URL is determined by its worst metric. A page with good LCP and CLS but poor INP counts as poor.
The thresholds behind the report
| Metric | Good | Needs improvement | Poor |
|---|---|---|---|
| Largest Contentful Paint | up to 2.5 s | 2.5–4 s | over 4 s |
| Interaction to Next Paint | up to 200 ms | 200–500 ms | over 500 ms |
| Cumulative Layout Shift | up to 0.1 | 0.1–0.25 | over 0.25 |
Values are assessed at the 75th percentile of visits, meaning three out of four visits must meet the threshold for the group to be considered good.
Why URLs are grouped
Most pages do not have enough traffic for individual statistics, so Search Console groups URLs that it considers similar, typically pages that share a template, and reports the group’s aggregated data. When you click an issue such as “LCP issue: longer than 2.5s (mobile)”, you see a list of URL groups with an example URL and the number of similar URLs in each.
This grouping is useful: if a group of 300 product pages has an LCP issue, the problem is almost certainly in the product template, not in 300 separate pages. Fix the template once, and all of them improve.
Reading the report step by step
- Start with mobile. Mobile is usually worse, and most visitors to small-business sites use phones.
- Open the details table below the chart. Each row is an issue, such as “INP issue: longer than 200ms”, with its status and number of URLs.
- Click an issue to see the affected URL groups and example URLs.
- Click an example URL to see group details, then use the link to PageSpeed Insights to analyse that URL.
- Identify the template. Look at the example URLs and ask which page type they represent: product, category, article, landing page.
- Diagnose with lab tools. Use PageSpeed Insights diagnostics and Chrome DevTools on the example URL to find the cause.
Typical findings and what they usually mean
- LCP issue on all pages: slow server response or missing caching, or a site-wide header element such as a large logo or banner.
- LCP issue on one template: the main image on that template is too large, lazy-loaded or discovered late.
- CLS issue on articles: images or embeds without dimensions, ads, or late-injected content in the article template.
- CLS issue site-wide: cookie banner, announcement bar or web fonts.
- INP issue site-wide: heavy JavaScript from the theme, builder or third-party tags.
- INP issue on shop pages: filters, variation selectors or cart scripts that do too much on each interaction.
An example investigation
Imagine the mobile report for a small online shop shows about 400 poor URLs with the issue “LCP issue: longer than 4s (mobile)”, while blog posts and the home page are fine. The example URLs are all product pages. PageSpeed Insights on one of them shows that the LCP element is the main product photo, which is served at full camera resolution and lazy-loaded by the theme. The lab LCP breakdown shows most of the time spent in resource load delay and download. The fix happens once, in the product template: the main image is excluded from lazy loading, gets high fetch priority, and WooCommerce’s image sizes are adjusted so a suitably sized WebP version is served. A lab test on three product pages confirms the improvement. The shop owner clicks “Validate fix”, and over the next four weeks the poor URLs move to good as new real-user data arrives.
The same method works for any issue: use the grouping to find the template, use one example URL to find the cause, fix the template, confirm in the lab, then validate.
Using the report together with other data
The Core Web Vitals report becomes more useful when combined with your other information. Compare the affected templates with your analytics: a poor group of pages that receives little traffic is less urgent than a poor group that includes your main landing pages. Compare dates of changes in the chart with your change log to find what caused a regression. And compare with the Search Console performance report to see whether the affected pages matter for search traffic. Prioritising this way keeps effort focused on the problems that affect the most visitors.
Validating a fix
After fixing a problem, open the issue in the report and click “Validate fix”. Search Console then monitors the affected URLs for 28 days, the length of the data window. During that period, the validation status shows as started or pending. If the group’s metrics meet the threshold over the full window, validation passes; if not, it fails and you can try again after further changes.
Keep in mind:
- Validation does not speed up the data; it only tracks it.
- Real visitors must visit the pages during the window for data to be collected.
- Check a lab test first to make sure the fix works before starting validation.
Common questions about the data
- “Not enough usage data” means your site or some pages do not have enough Chrome visits for reporting. Use PageSpeed Insights lab tests instead.
- URL counts change without any change on the site because the grouping and the set of pages with enough traffic vary over time.
- Numbers differ from PageSpeed Insights because PageSpeed shows single-URL or origin data, while Search Console shows grouped data, and their collection periods may differ slightly.
- A sudden jump in poor URLs often coincides with a release: new theme version, plugin, tag or design. Compare dates with your change log.
How often to check
For most small-business sites, a monthly review is enough, plus a check a few weeks after any significant change. Search Console can also send e-mail notifications when new Core Web Vitals issues are detected, so make sure the right person receives messages for the property. Agencies should include the report’s status in their regular client reporting, because it is the most direct view of what Google sees.
How Site AI Audit helps
Search Console tells you which groups of pages have a problem; Site AI Audit helps with the next step. Each check runs Google PageSpeed for mobile, measures server response time, compression and page weight, and crawls up to 50 pages on the free check for SEO issues, with findings explained in plain words and ranked by impact. Paid plans add re-checks to confirm your fix in the lab before starting validation; see the plans.
Related reading
- Core Web Vitals Explained for Small Business Websites
- How to Read a PageSpeed Insights Report Without Guesswork
- How to Set Up Google Search Console for a Small Business
- How to Read the Search Console Performance Report
The bottom line
The Core Web Vitals report in Search Console is your site-wide view of real-user speed. Start with mobile, click into each issue, identify the template behind the affected URL group, diagnose an example with PageSpeed Insights and DevTools, fix it once for the whole template, and validate. Then check the report monthly so new problems are caught early.
الأسئلة الشائعة
What does the Core Web Vitals report in Search Console show?
It shows how real Chrome users experience your pages, split into mobile and desktop, and classifies groups of URLs as good, needs improvement or poor based on LCP, INP and CLS over the last 28 days.
Why does Search Console group my URLs?
Most individual pages do not have enough traffic for separate statistics, so Search Console groups similar pages, usually sharing a template, and reports their combined data. One issue in a group usually points to one template problem.
How long does validation take?
Validation monitors the affected URLs for 28 days, matching the data collection window. Real visitors must use the pages during that time for the new data to be collected.
Why does my site show “not enough usage data”?
Your pages do not have enough visits from Chrome users who share usage statistics to produce reliable data. This is common for small sites. Use PageSpeed Insights lab tests as a guide instead.
Why are Search Console and PageSpeed Insights different?
PageSpeed Insights shows data for a single URL or the whole origin, while Search Console shows grouped data for similar URLs. The collection periods and grouping explain most differences.