ENEnglish
 LTLietuviškai
 DEDeutsch
 FRFrançais
 RUРусский
 ESEspañol
 PLPolski
 ITItaliano
 UKУкраїнська
 CSČeština
 PTPortuguês
 JA日本語
 LVLatviešu valoda
 ETEesti
 HUMagyar
 IDBahasa Indonesia
 TRTürkçe
 HIहिन्दी
 ELΕλληνικά
 ARالعربية
 THไทย
 VITiếng Việt
 RORomână
 MSBahasa Melayu
 BNবাংলা
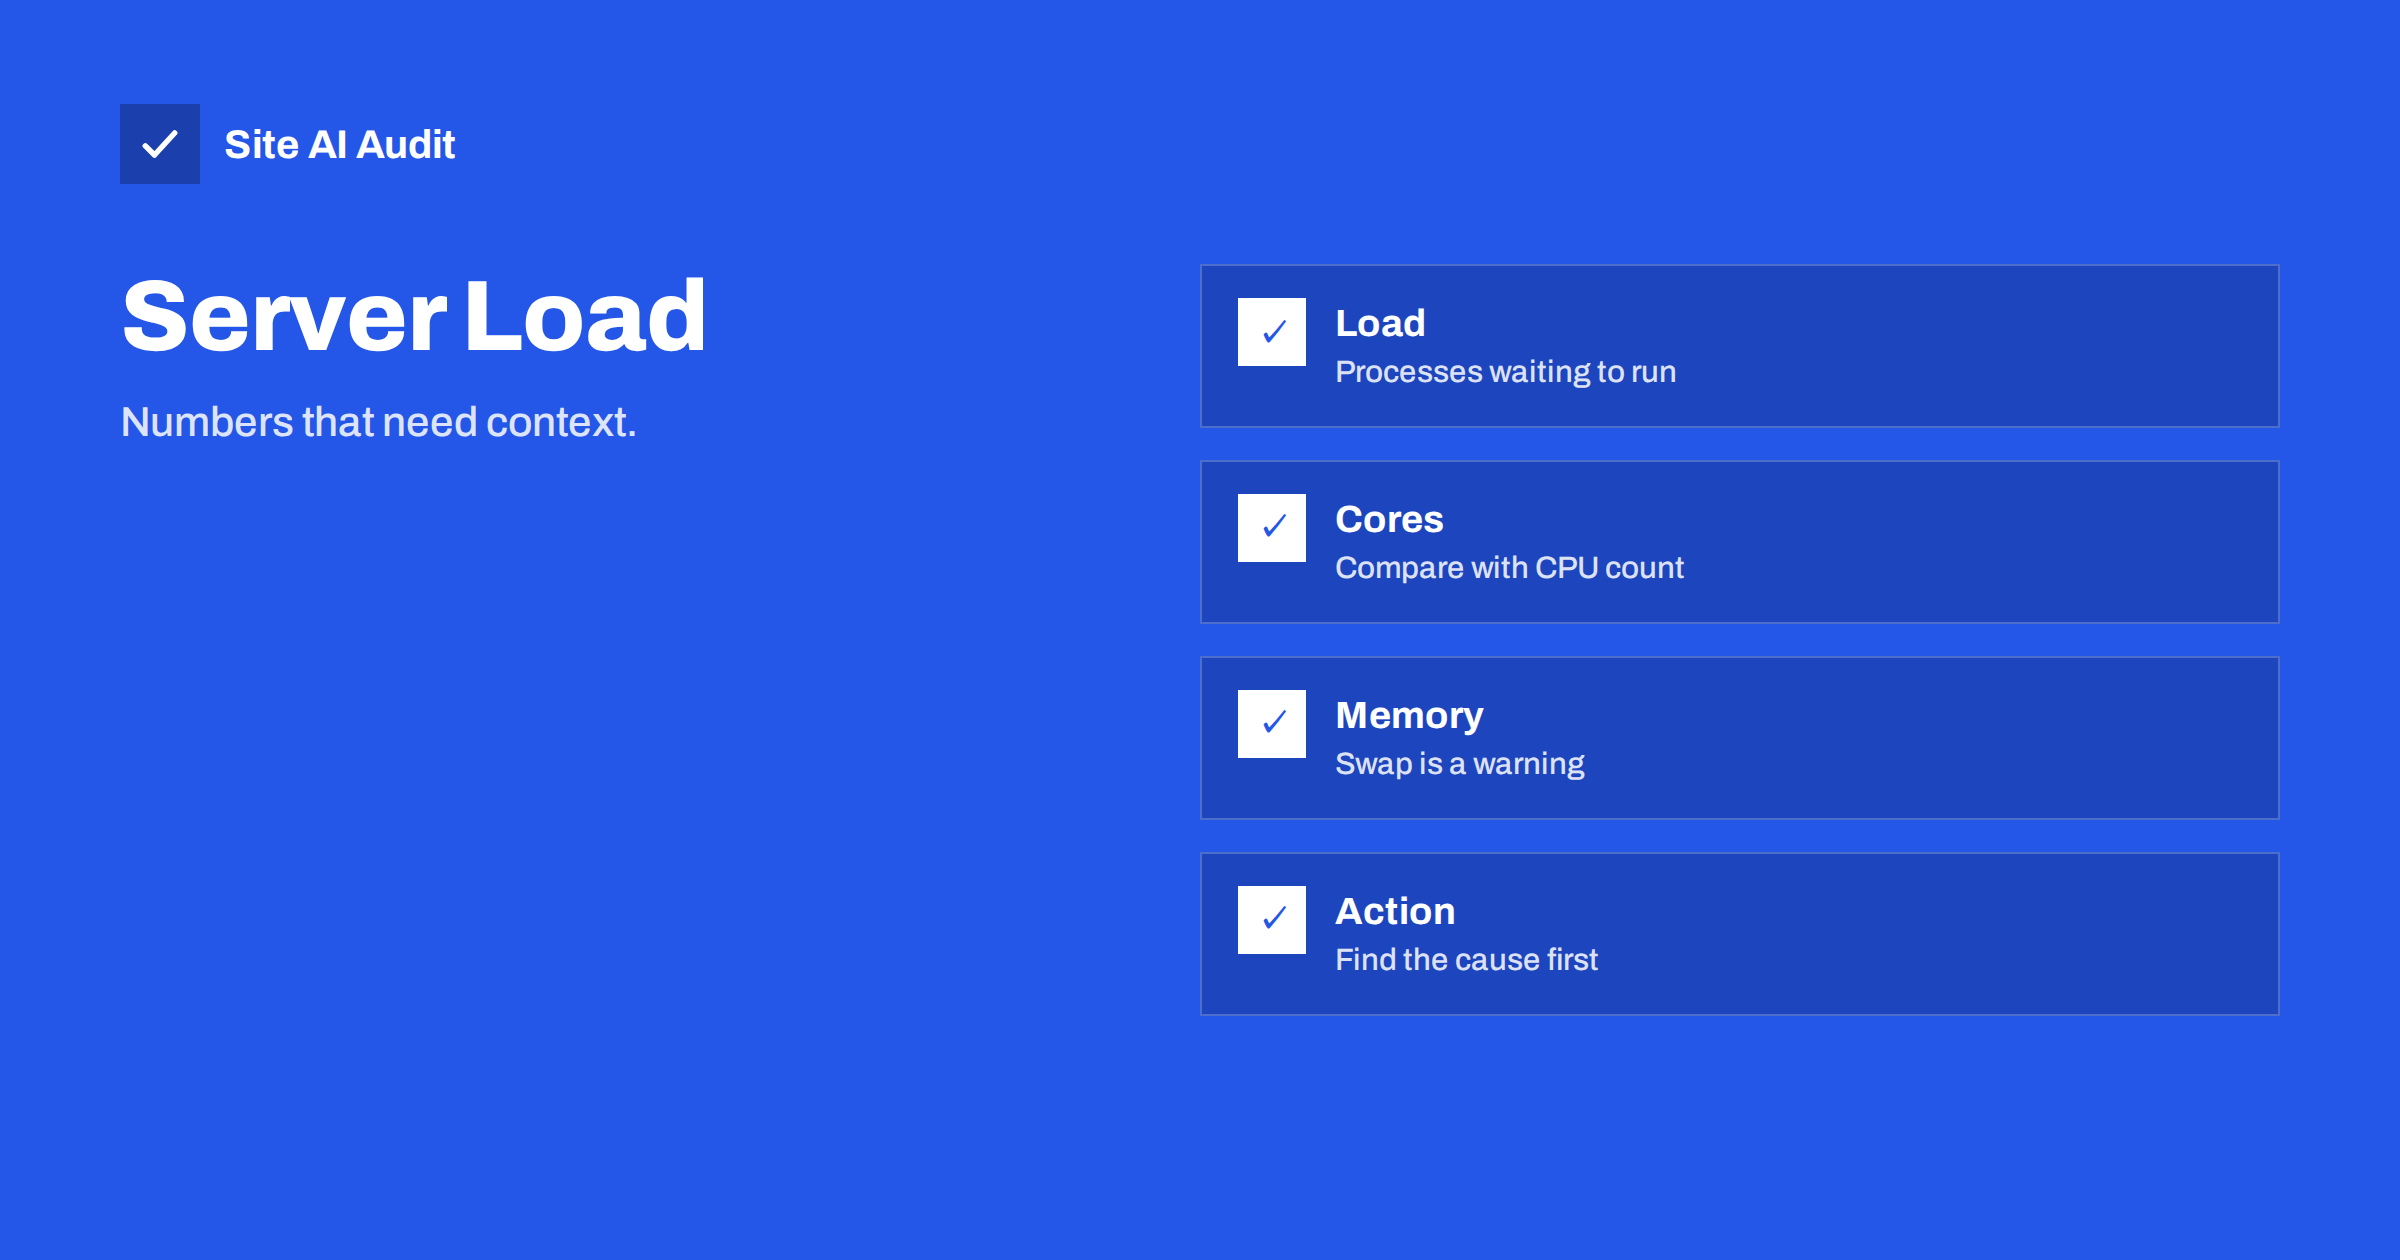
Short answer: Load average is the average number of processes that are running or waiting for a turn on the processor over the last one, five and fifteen minutes. A load equal to the number of CPU cores means the server is fully busy. A load far above that, together with slow pages, means that work is queuing. Read it along with CPU, memory and disk figures, and find what is using resources before you pay for a bigger plan.
What load average really measures
On Linux servers, three numbers such as 0.52, 0.71, 1.04 describe the load over the last one, five and fifteen minutes. Each is a count of tasks that were ready to run or that were waiting for disk input and output. The count is averaged over the time period. It is not a percentage, and it is not the same as processor use, though they are related.
The important point is to compare the number with the number of CPU cores. On a server with one core, a load of 1.0 means that the core is busy all the time and nothing waits. A load of 3.0 means that, on average, two tasks are waiting. On a server with four cores, a load of 4.0 has the same meaning as 1.0 on a single core, and a load of 2.0 means that half of the capacity is free. If the three numbers are rising from right to left, the load is growing. If they fall from right to left, the busy period is ending.
Other numbers to read together
- CPU use. Shows how much of the processing power is in use. High CPU with a high load points to heavy computation, such as page building without cache or image processing.
- Wait for input and output. High wait means that processes wait for the disk. The load can be high even when CPU use is low. Slow storage or a heavy database may be the cause.
- Memory and swap. When memory runs out, the system moves data to disk (swap), which is much slower. Heavy swap use is a clear warning. The article on the PHP memory limit shows a related problem inside the application.
- Number of processes. A sudden rise can show a traffic spike, a loop or an attack. See slow sites during traffic spikes.
- Disk space and inodes. A full disk can stop a database or the logs. The next sections cover limits that hosting plans set.
Shared hosting limits and what they mean
On shared hosting you often do not see the server load, because it belongs to all customers. Instead, the control panel shows limits for your account: CPU time or percentage, memory, the number of simultaneous processes, and input and output speed. When you reach a limit, the host slows or stops your processes, and visitors see errors or very slow pages. A common sign is the “resource limit reached” message described in the article on the 508 error.
These limits are not an insult to your site. They are how the host keeps one account from harming the others. The useful questions are what uses the resources and whether it should. A modest site with ten visitors an hour should rarely hit a limit, so something unusual is probably happening.
What commonly causes high load
- Uncached pages. Every visit makes the server run code and queries. Page caching can cut work by a large factor. See page caching.
- Bots and crawlers. Aggressive or fake bots can send more requests than all human visitors combined, as covered in bad bots.
- Heavy plugins and slow queries. One plugin that runs a large query on every page can dominate the load. The guide to finding slow plugins shows how to isolate them.
- Scheduled jobs. Backups, imports and cron tasks that run during busy hours. The article on WP-Cron explains how to move them.
- Login attacks. Thousands of attempts on the login page use CPU for each try. See brute force protection.
- Too few PHP workers. Requests queue while workers wait. See PHP workers.
A calm way to investigate
- Find the time window. Look at hosting graphs to see when load was high and compare it with the time that visitors complained.
- Read the access log for that window. Count requests by address, by path and by user agent. A few addresses or one path often stand out. The guide to reading access logs shows how.
- Check the error log. Repeated errors can drive load through retries.
- Look at the database. A slow query log shows which queries take the most time. See slow database queries.
- Change one thing at a time. Turn on caching, block an abusive bot, remove a plugin or move a task, then watch the graph. Several changes at once hide what worked.
When to upgrade the plan
If you have removed waste, cached what you can and blocked abuse, and the site still reaches its limits during normal traffic, then the plan is too small. A larger shared plan, a virtual server or a managed platform gives more room. The article on shared hosting and VPS explains the trade-offs. Upgrading without finding the cause usually delays the same problem by a few months.
Disk space and inode limits
Two other limits catch owners by surprise. Disk space is the total size of your files. An inode is a record for each file or folder, so a site with millions of tiny files, such as cache fragments, session files or unsent email, can reach the inode limit while using little space. When that happens, new files cannot be created, uploads fail and backups stop. Look at the usage figures in your control panel, find the folders with the most files and delete or rotate what you do not need, such as old cache folders and logs. Do not delete anything unless you know what it does, and keep a backup before you clean up.
A worked example: slow evenings on a small shop
A shop owner notices that pages take six seconds to load every evening around eight, although mornings are fast. The hosting graph shows CPU at its limit between seven and nine. The access log for that window shows that three quarters of the requests come from one search bot requesting filtered product lists with endless combinations of parameters, which cannot be cached. The owner adds rules to robots.txt, asks the plugin to stop generating links for empty filters and enables page caching for the category pages. The next evening, CPU use stays at about a third of the limit and pages load in under two seconds. No upgrade was necessary.
The steps were simple: find the time, read the log, find the biggest consumer and remove its cost. The same method works whatever the cause turns out to be.
Common mistakes when reading server stats
- Judging load without the core count. A load of 4 is a crisis on one core and a quiet moment on sixteen.
- Looking only at averages. Short spikes, such as a backup that runs for two minutes, may not show in a fifteen-minute average yet still slow visitors.
- Ignoring the time zone of the graphs. Servers often report in UTC. Convert the time before you compare it with visitor complaints.
- Blaming the host too early. Hosts do sometimes oversell servers, but a plugin, a bot or a missing cache is the more common cause.
- Cleaning up blindly. Deleting files to free inodes or disk space without knowing what they are can break the site.
If you use a monitoring service, set alerts on response time and on resource limit messages, so that you learn about a problem before customers do. The article on uptime monitoring explains what to track and how to avoid false alarms.
How Site AI Audit helps
Site AI Audit cannot see your server load or your hosting account limits. It measures what visitors feel: server response time, the Google PageSpeed score, Core Web Vitals, compression and page weight. If the response time is high on simple pages, it is a hint that the server is struggling, and it gives you a time and a number to bring to your host. The free check covers up to 50 pages and needs no sign-up. You can run a free check of your website or see the plans for re-checks and weekly monitoring.
Related reading
- PHP Workers Explained: Why a Busy Site Slows Down
- Resource Limit Reached and 508 Errors on Shared Hosting
- Why Your Website Slows Down or Crashes During Traffic Spikes
- How to Reduce Server Response Time (TTFB) for Faster Pages
The bottom line
Compare load average with your CPU cores, read it together with memory, disk and wait figures, and find the cause before you buy more capacity. Caching, blocking abusive traffic and fixing heavy plugins are cheaper than a bigger server and usually work better.
FAQ
What is a good load average?
A load below the number of CPU cores is generally comfortable. A load that stays far above the core count while pages are slow means work is queuing.
Why is load high when CPU use is low?
Tasks waiting for the disk or network count in the load. Slow storage, a busy database or a full disk can raise it without raising CPU use.
Can I see load on shared hosting?
Often not directly. Your control panel usually shows account limits for CPU, memory, processes and input and output instead. Ask your host if you need more detail.
Does more traffic always mean more load?
Not if pages are cached. With good caching a site can serve many more visitors with little load. Without it, each visit costs a full page build.
Should I restart the server when load is high?
A restart may clear the symptom for a while but does not remove the cause. Find what started the load, or it will return.